
Reason to trust
How Our News is Made
Strict editorial policy that focuses on accuracy, relevance, and impartiality
Ad discliamer
Morbi pretium leo et nisl aliquam mollis. Quisque arcu lorem, ultricies quis pellentesque nec, ullamcorper eu odio.
Ethereum corrected lower below $2,100 against the US Dollar, but stayed above $2,050. ETH price is likely to start a fresh increase as long as it is above the $2,000 support.
- Ethereum is showing signs of a fresh increase above $2,120 and $2,150.
- The price is now trading nicely above the $2,080 support and the 100 hourly simple moving average.
- There is a major contracting triangle forming with resistance near $2,120 on the hourly chart of ETH/USD (data feed via Kraken).
- The pair is likely to continue higher above the $2,120 and $2,150 levels in the near term.
Ethereum Price Remains In Uptrend
After setting a new all-time high near $2,150, Ethereum started a downside correction. ETH traded below the $2,120 and $2,100 support levels.
However, the bulls were active near the $2,050 support zone and the 100 hourly simple moving average. A low was formed near $2,050 before the price climbed higher. The recent swing high was near $2,132 and the low was formed near $2,083.
Ether is now rising and trading above $2,100. There was a break above the 50% Fib retracement level of the recent decline from the $2,132 high to $2,083 low.
It seems like there is a major contracting triangle forming with resistance near $2,120 on the hourly chart of ETH/USD. The triangle resistance is close to the 61.8% Fib retracement level of the recent decline from the $2,132 high to $2,083 low.
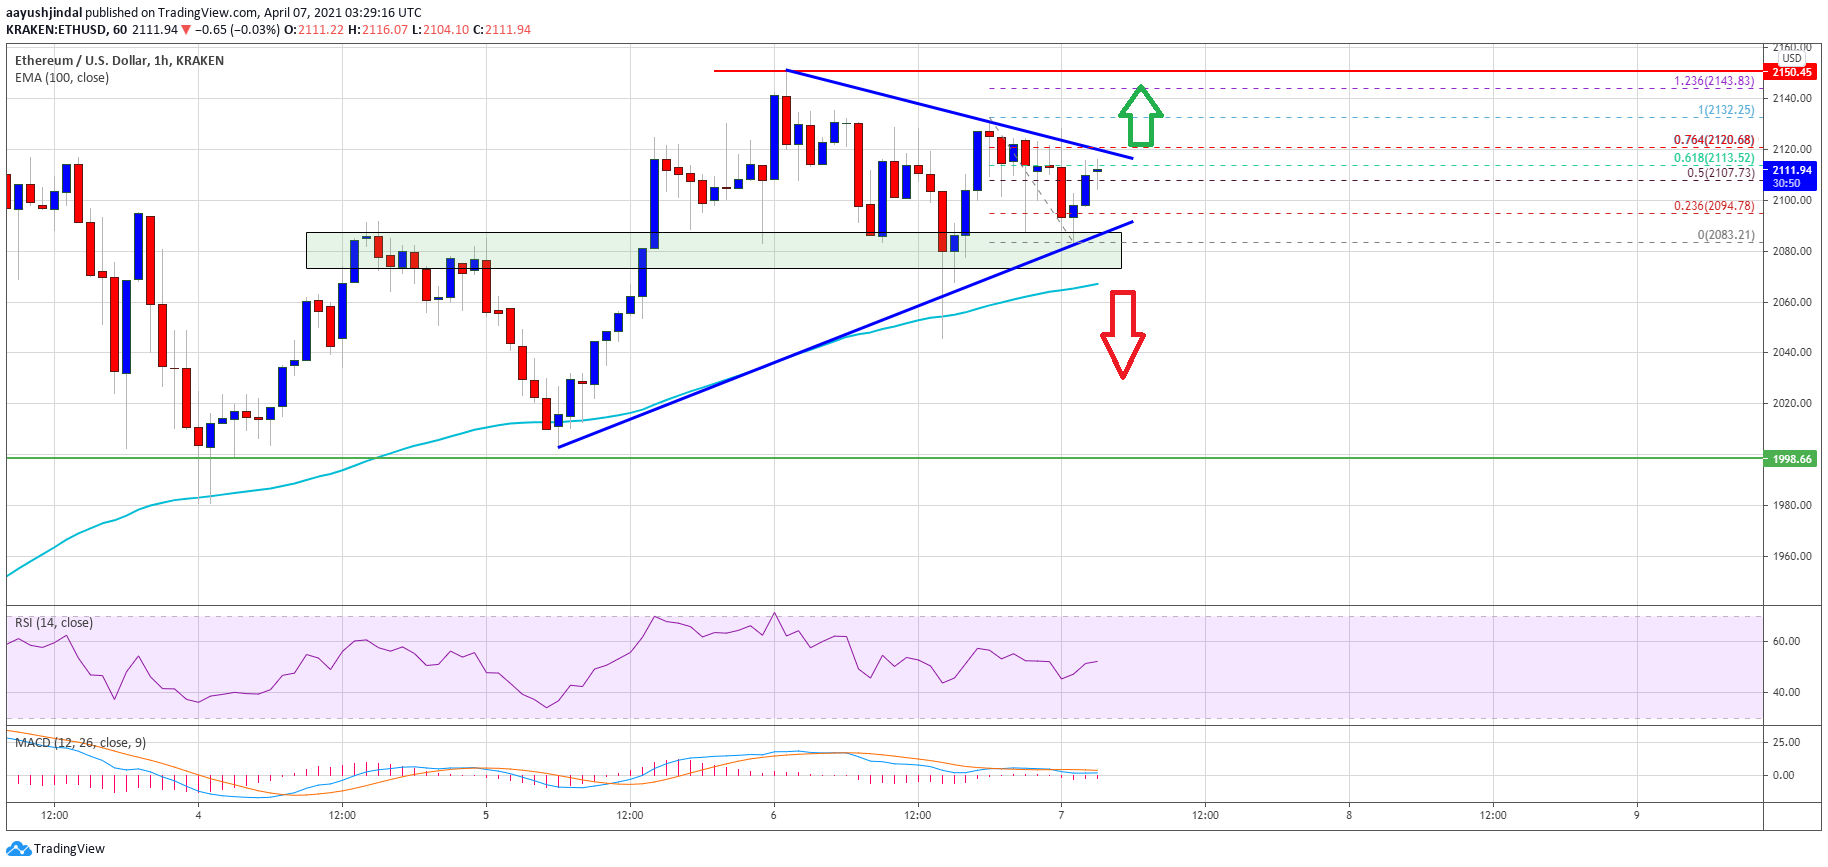
Source: ETHUSD on TradingView.com
A successful break above the triangle resistance could open the doors for a fresh increase above $2,150. In the stated case, the price is likely to rally towards $2,200 or $2,250. The next key barrier for the bulls could be $2,320.
Downside Breaks in ETH?
If Ethereum fails to clear the $2,120 resistance, it could correct lower. The first major support is now forming near the $2,080 level and the triangle lower trend line.
The main support is still near the $2,050 level and the 100 hourly simple moving average. Any more losses might call for a test of the $2,000 support, below which the price might test the $1,920 level in the coming sessions.
Technical Indicators
Hourly MACD – The MACD for ETH/USD is slowly gaining momentum in the bullish zone.
Hourly RSI – The RSI for ETH/USD is now just above the 50 level.
Major Support Level – $2,050
Major Resistance Level – $2,120