
Reason to trust
How Our News is Made
Strict editorial policy that focuses on accuracy, relevance, and impartiality
Ad discliamer
Morbi pretium leo et nisl aliquam mollis. Quisque arcu lorem, ultricies quis pellentesque nec, ullamcorper eu odio.
Ethereum started a major decline below the $3,200 support zone against the US Dollar. ETH price traded as low as $2,807 and it is now attempting a recovery wave.
- Ethereum started a fresh decline below the $3,300 and $3,200 support levels.
- The price is now trading below $3,200 and the 100 hourly simple moving average.
- There is a key bearish trend line forming with resistance near $3,020 on the hourly chart of ETH/USD (data feed via Kraken).
- The pair could a steady recovery wave if there is a close above $3,050 in the near term.
Ethereum Price Corrects Losses
Ethereum started a major decline from the $3,500 resistance zone. ETH traded below many important support zones near $3,300 and the 100 hourly simple moving average, similar to bitcoin.
The bears gained strength below the $3,200 support zone. Finally, ether spiked below $3,000 and extended its decline. A low is formed near $2,807 and the price is now correcting losses. There was a break above the $2,920 and $2,950 resistance levels.
The price recovered above the 23.6% Fib retracement level of the recent decline from the $3,455 swing high to $2,807 low. An immediate resistance on the upside is near the $3,020 level. There is also a key bearish trend line forming with resistance near $3,020 on the hourly chart of ETH/USD.
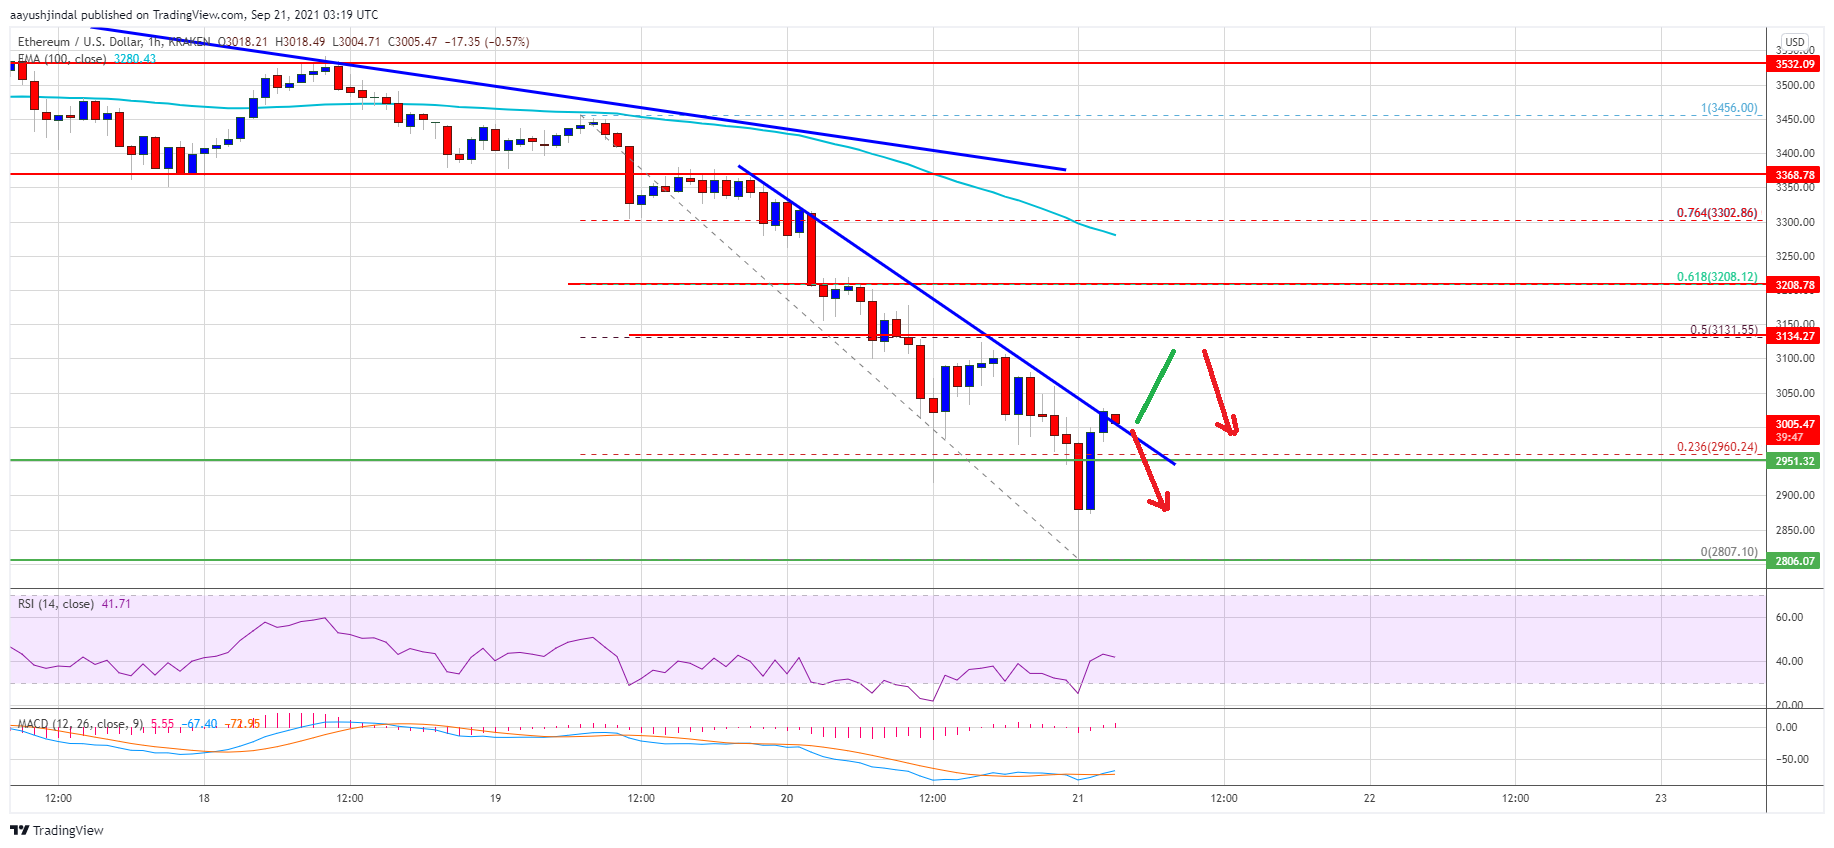
Source: ETHUSD on TradingView.com
A close above the $3,020 and $3,050 levels could start a decent recovery. The next major resistance might be near the $3,130 level. It is near the 50% Fib retracement level of the recent decline from the $3,455 swing high to $2,807 low. A clear break and close above the $3,130 level could start a steady increase. The next major resistance sits near $3,300.
More Losses in ETH?
If ethereum fails to correct higher above the $3,020 and $3,050 resistance levels, it could start another decline. An initial support on the downside is near the $2,960 level.
The next major support seems to be forming near the $2,900 level. A downside break below the $2,900 support zone could lead the price towards the $2,800 zone. The next major support is near the $2,750 level, below which ether price might decline towards the $2,640 support zone.
Technical Indicators
Hourly MACD – The MACD for ETH/USD is slowly losing pace in the bearish zone.
Hourly RSI – The RSI for ETH/USD is still well below the 50 level.
Major Support Level – $2,960
Major Resistance Level – $3,050