Reason to trust
How Our News is Made
Strict editorial policy that focuses on accuracy, relevance, and impartiality
Ad discliamer
Morbi pretium leo et nisl aliquam mollis. Quisque arcu lorem, ultricies quis pellentesque nec, ullamcorper eu odio.
Ethereum price popped above the $1,850 resistance against the US dollar. ETH is showing positive signs and might soon climb toward the $2,000 resistance.
- Ethereum is slowly moving higher above the $1,850 resistance zone.
- The price is trading above $1,820 and the 100-hourly Simple Moving Average.
- There was a break above a key declining channel with resistance near $1,818 on the hourly chart of ETH/USD (data feed via Kraken).
- The pair is signaling bullish signs and a possible move toward the $2,000 resistance.
Ethereum Price Aims Higher
Ethereum formed a base above the $1,780 level and recently started a steady increase, like Bitcoin. ETH gained pace for a move above the $1,820 resistance zone.
There was a break above a key declining channel with resistance near $1,818 on the hourly chart. It sparked bullish moves and pushed the price above the main hurdle at $1,850. The price traded to a new multi-week high at $1,875 and is currently consolidating gains.
Ethereum is now trading above $1,820 and the 100-hourly Simple Moving Average. It is also above the 23.6% Fib retracement level of the recent increase from the $1,784 swing low to the $1,875 high.
On the upside, the price is facing resistance near the $1,875 level. If ETH surpasses the $1,875 resistance, it could again start a steady increase and test $1,920. The next key resistance is near $1,950, above which the price could accelerate higher toward the $2,0000 level.
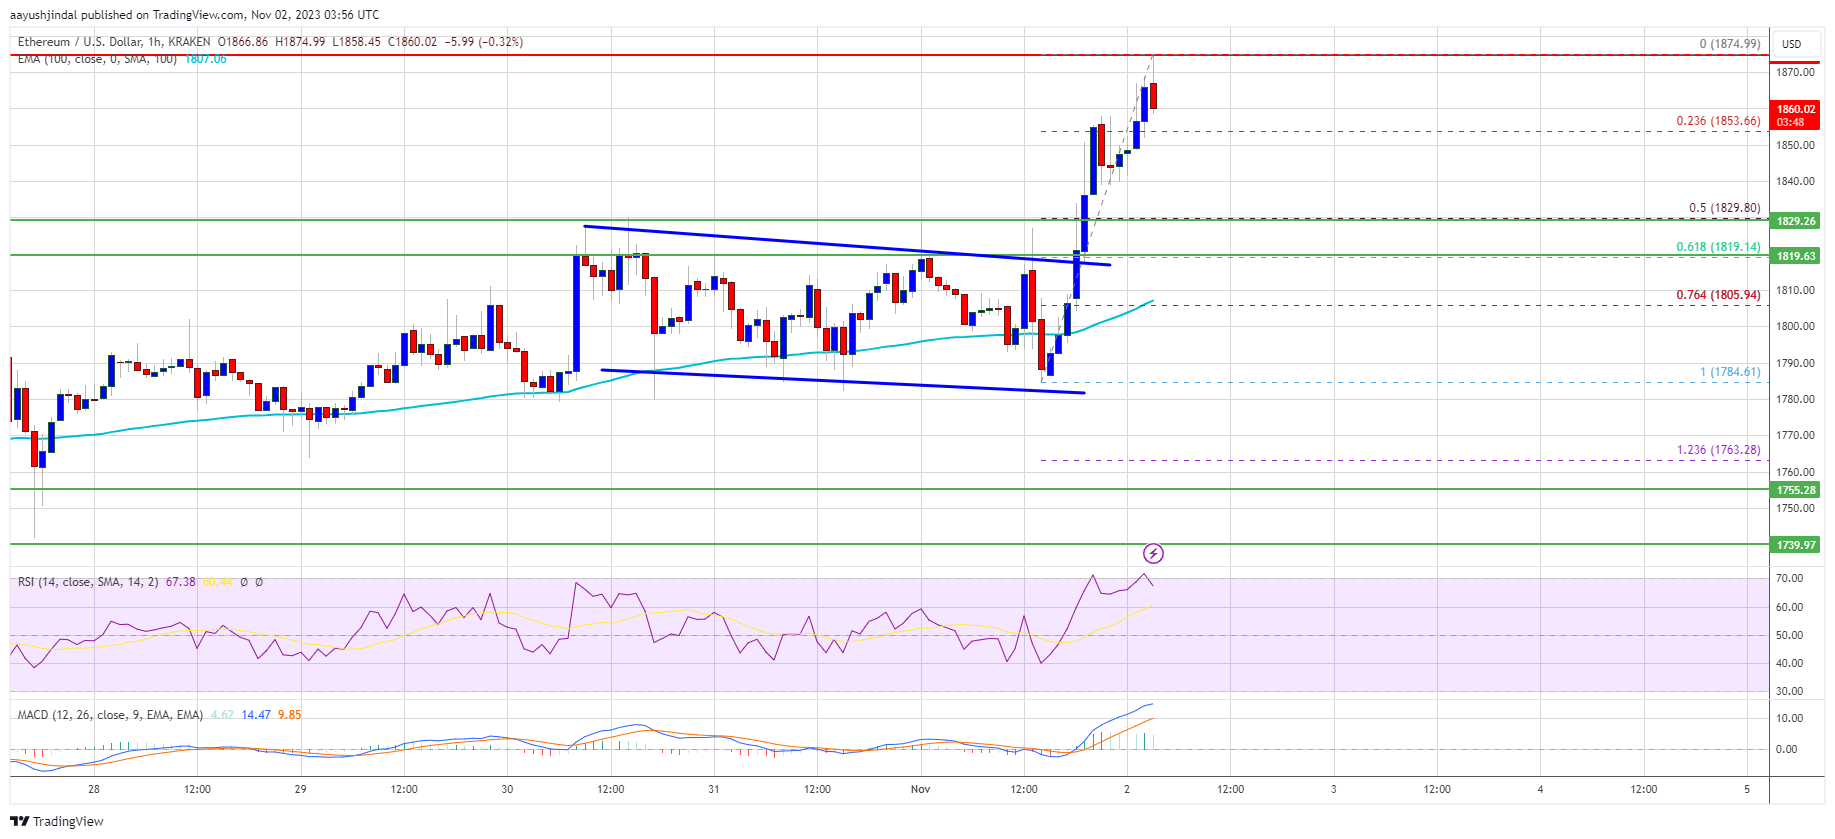
Source: ETHUSD on TradingView.com
Any more gains might call for a move toward the $2,050 level. In the stated case, the price could even climb toward the $2,120 level.
Are Dips Limited in ETH?
If Ethereum fails to clear the $1,875 resistance, it could start a downside correction. Initial support on the downside is near the $1,850 level.
The next key support is $1,820 or the 61.8% Fib retracement level of the recent increase from the $1,784 swing low to the $1,875 high. The main support is now forming near the $1,800 level and the 100-hourly Simple Moving Average. A downside break below the $1,800 support might spark a bearish wave. In the stated case, Ether could drop toward the $1,750 level.
Technical Indicators
Hourly MACD – The MACD for ETH/USD is gaining momentum in the bullish zone.
Hourly RSI – The RSI for ETH/USD is now above the 50 level.
Major Support Level – $1,820
Major Resistance Level – $1,875