
Reason to trust
How Our News is Made
Strict editorial policy that focuses on accuracy, relevance, and impartiality
Ad discliamer
Morbi pretium leo et nisl aliquam mollis. Quisque arcu lorem, ultricies quis pellentesque nec, ullamcorper eu odio.
Ethereum is up 3% and it is trading nicely above $400 against the US Dollar. ETH price is showing positive signs and it could rally if there is a clear break above $410.
- Ethereum is back above the key $400 and $402 support levels.
- The price is currently facing a major hurdle near $410, but it is above the 100 hourly simple moving average.
- There is a crucial contracting triangle forming with resistance near $408 on the hourly chart of ETH/USD (data feed via Kraken).
- The pair could resume its rally if it clears the $408 and $410 resistance levels in the near term.
Ethereum Price is Showing Bullish Signs
After a strong rally in bitcoin, Ethereum too gained traction and climbed above the $395 and $400 resistance levels. The upward move was such that ETH price settled above $400 and the 100 hourly simple moving average.
There was also a break above yesterday’s highlighted bearish trend line with resistance near $398 on the hourly chart of ETH/USD. It opened the doors for more gains above $405, but ether price struggled to clear the $410 resistance zone.
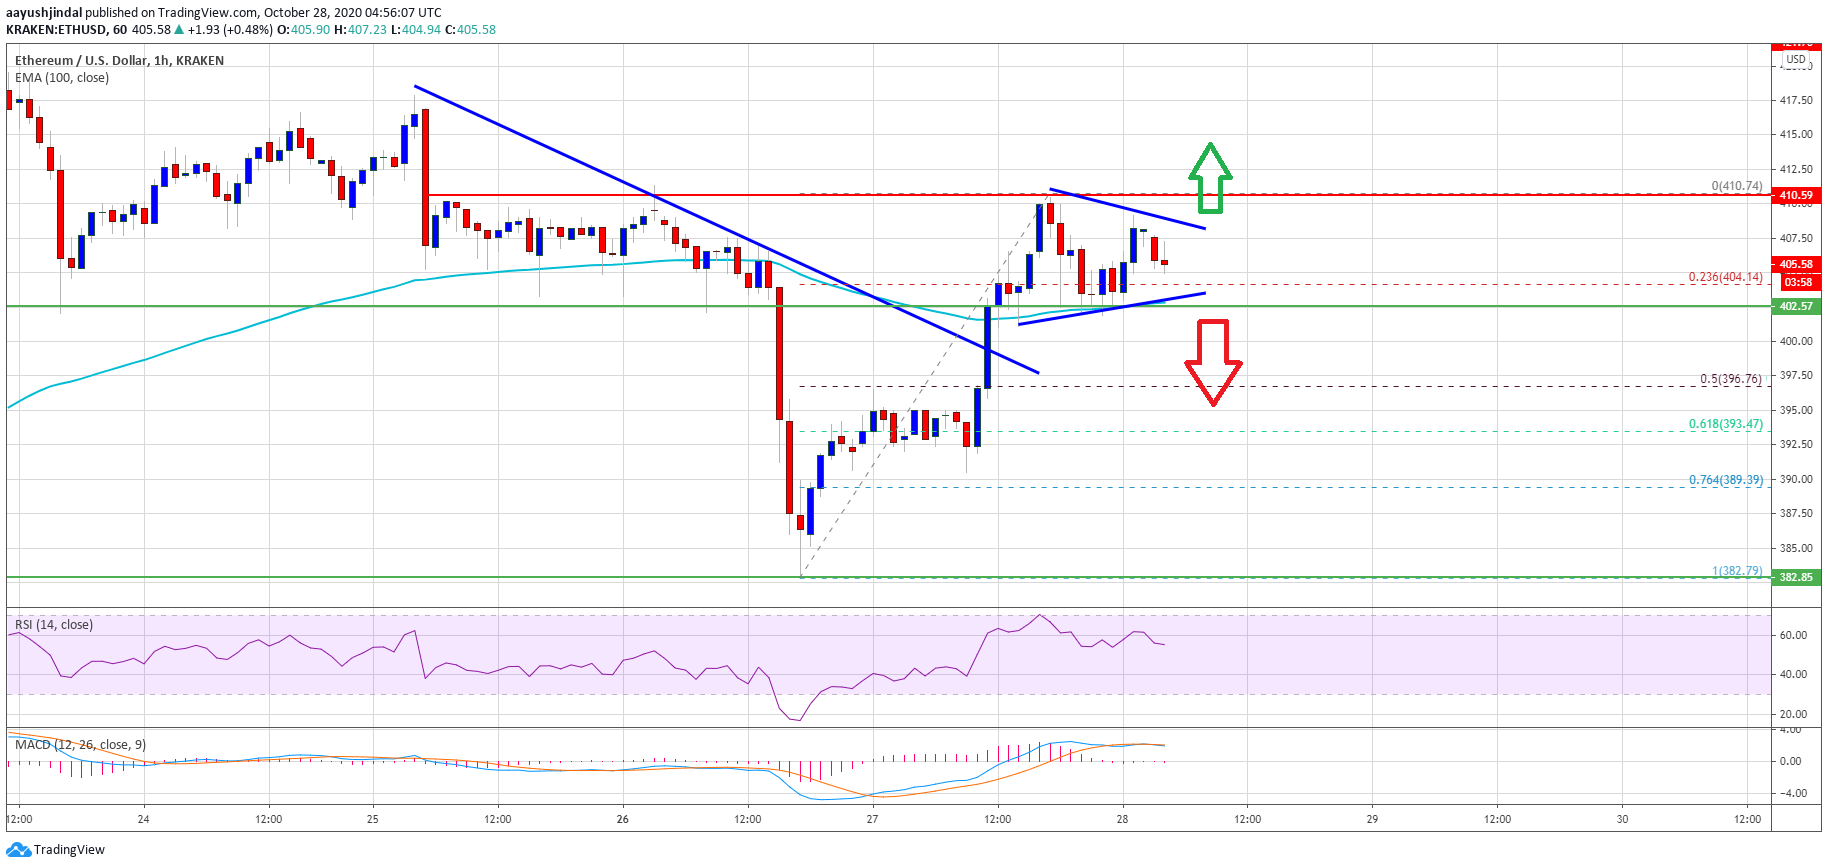
Source: ETHUSD on TradingView.com
A high is formed near $410 and the price is currently consolidating gains. There was a minor correction below $408, but the price stayed above the 23.6% Fib retracement level of the upward move from the $383 low to $410 high.
It seems like there is a crucial contracting triangle forming with resistance near $408 on the same chart. If there is a clear break above the $408 and $410 resistance levels, the price could rally. The next key resistance is near $418, above which the bulls might aim a new monthly high above $422.
Downside Break in ETH?
If Ethereum fails to clear the $408 and $410 resistance levels, there is a risk of a fresh decline. An initial support on the downside is near the triangle trend line at $402.
A clear break below the triangle support might open the doors for a fresh decline below $400. The next major support is near $396 level or the 50% Fib retracement level of the upward move from the $383 low to $410 high, below which ether could revisit the $385 support zone.
Technical Indicators
Hourly MACD – The MACD for ETH/USD is struggling to gain pace in the bullish zone.
Hourly RSI – The RSI for ETH/USD is now above the 50 level.
Major Support Level – $402
Major Resistance Level – $410