
Reason to trust
How Our News is Made
Strict editorial policy that focuses on accuracy, relevance, and impartiality
Ad discliamer
Morbi pretium leo et nisl aliquam mollis. Quisque arcu lorem, ultricies quis pellentesque nec, ullamcorper eu odio.
Ethereum started a downside correction and traded below $1,600 against the US Dollar. ETH price found support near $1,487 and it is currently recovering losses.
- Ethereum started a downside correction below the $1,650 and $1,600 levels.
- The price is now trading below $1,650 and the 100 hourly simple moving average.
- There is a key bearish trend line forming with resistance near $1,660 on the hourly chart of ETH/USD (data feed via Kraken).
- The pair is likely to resume higher once it clears the $1,650 and $1,660 resistance levels in the near term.
Ethereum Price Remains Well Bid
After setting a new all-time high near $1,760, Ethereum started a short-term downside correction. ETH traded below the $1,650 and $1,600 support levels. There was also a break below the $1,560 support level and the 100 hourly simple moving average.
Ether tested the $1,500 support zone and a low is formed near $1,487. The price is currently moving higher and trading above the $1,550 level. There was a break above the 23.6% Fib retracement level of the downward move from the $1,763 high to $1,487 low.
The price is now facing resistance near $1,620 level and 100 hourly simple moving average. The 50% Fib retracement level of the downward move from the $1,763 high to $1,487 low is also at $1,625.
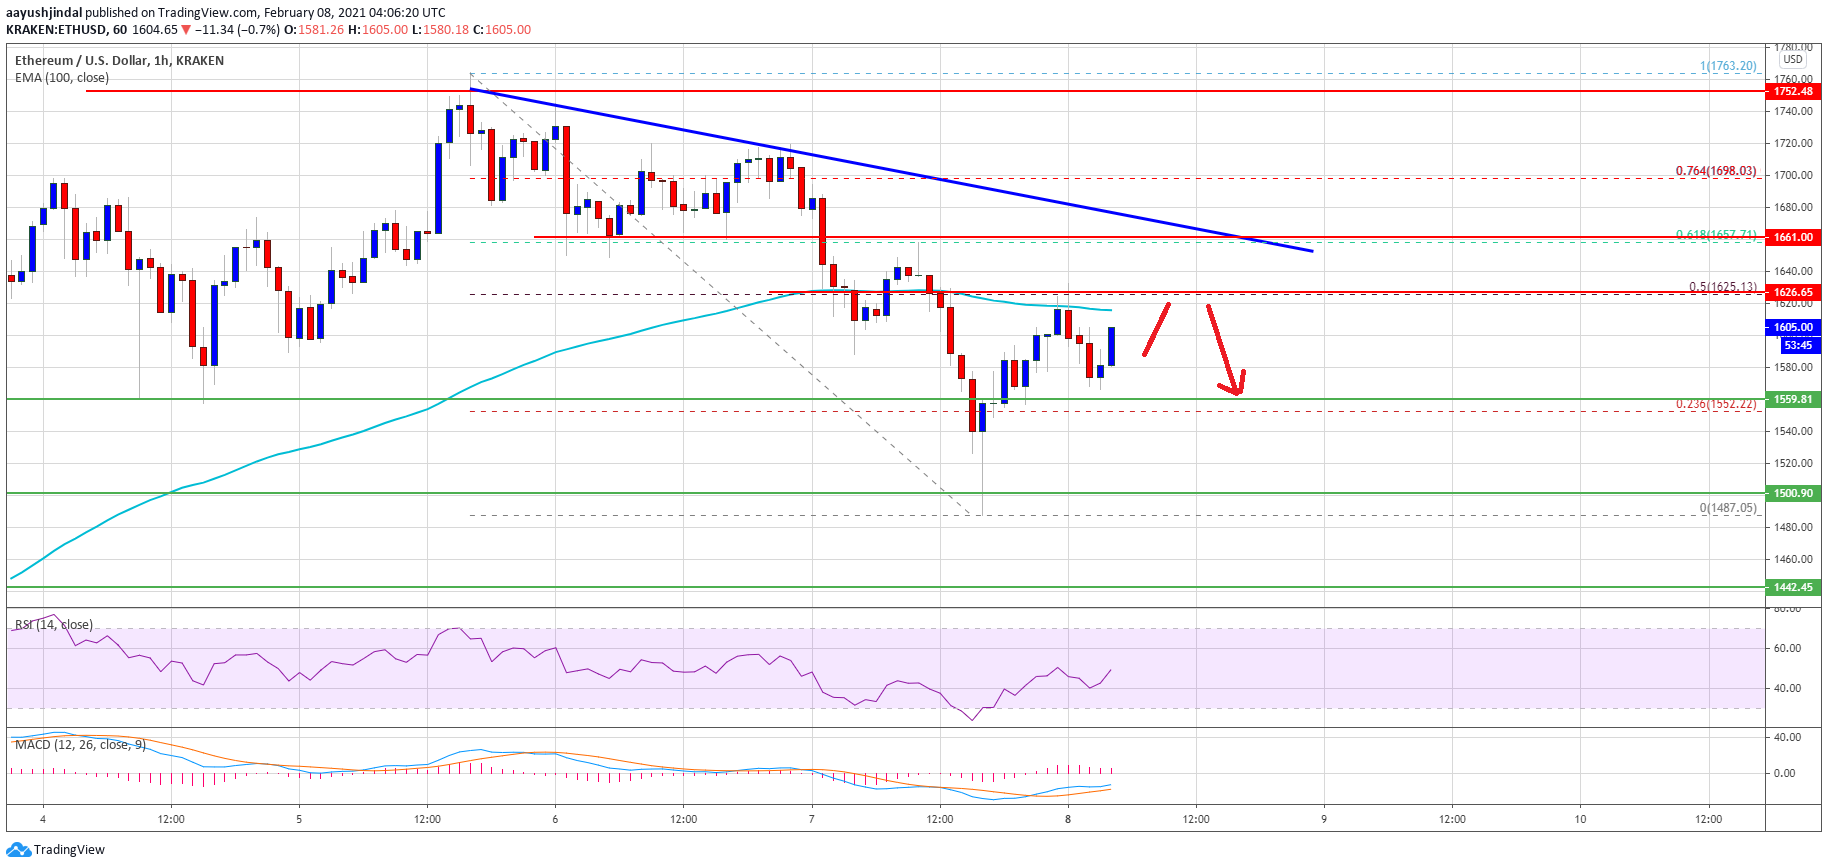
Source: ETHUSD on TradingView.com
The next key resistance is near the $1,650 level. There is also a key bearish trend line forming with resistance near $1,660 on the hourly chart of ETH/USD. A clear break above the trend line resistance and $1,665 could open the doors for a steady increase. In the stated case, the price is likely to revisit the $1,760 high in the near term.
Dips Supported in ETH?
If Ethereum fails to clear the $1,620 and $1,650 resistance levels, it could start a fresh decline. On the downside, an initial support is near the $1,560 and $1,550 levels.
A downside break below the $1,550 support zone might spark strong bearish moves. The next major support is near the $1,500 level, below which the price might decline towards the $1,450 support (a multi-touch zone).
Technical Indicators
Hourly MACD – The MACD for ETH/USD is slowly gaining momentum in the bullish zone.
Hourly RSI – The RSI for ETH/USD is currently just above the 50 level.
Major Support Level – $1,550
Major Resistance Level – $1,650