
Reason to trust
How Our News is Made
Strict editorial policy that focuses on accuracy, relevance, and impartiality
Ad discliamer
Morbi pretium leo et nisl aliquam mollis. Quisque arcu lorem, ultricies quis pellentesque nec, ullamcorper eu odio.
Polkadot’s DOT started a strong surge after it broke the $5.40 resistance against the US Dollar. It is up over 20% this week, and it even rallied above $7.00.
- DOT gained pace above the $5.40 and $6.00 levels to start a fresh increase against the US dollar.
- The price is now trading well above $7.00 and the 100 simple moving average (4-hours).
- There was a break above a major bearish trend line with resistance near $5.40 on the 4-hours chart of the DOT/USD pair (data source from Kraken).
- The pair traded as high as $7.68 and it is currently correcting lower.
Polkadot’s DOT Rallies Significantly
This week, DOT formed a strong support base above the $5.00 level. It started a steady increase and broke a couple of important hurdles near $5.40 to move into a bullish zone.
It even settled above the $5.50 level and 100 simple moving average (4-hours). More importantly, there was a break above a major bearish trend line with resistance near $5.40 on the 4-hours chart of the DOT/USD pair.
There was a sharp upward move above the $6.00 and $7.00 levels. The price traded to a new monthly high above $7.50 at $7.68, and it outperformed bitcoin and ETH. It is currently correcting lower and trading below $7.50. It already tested the 23.6% Fib retracement level of the recent increase from the $6.25 swing low to $7.68 high.
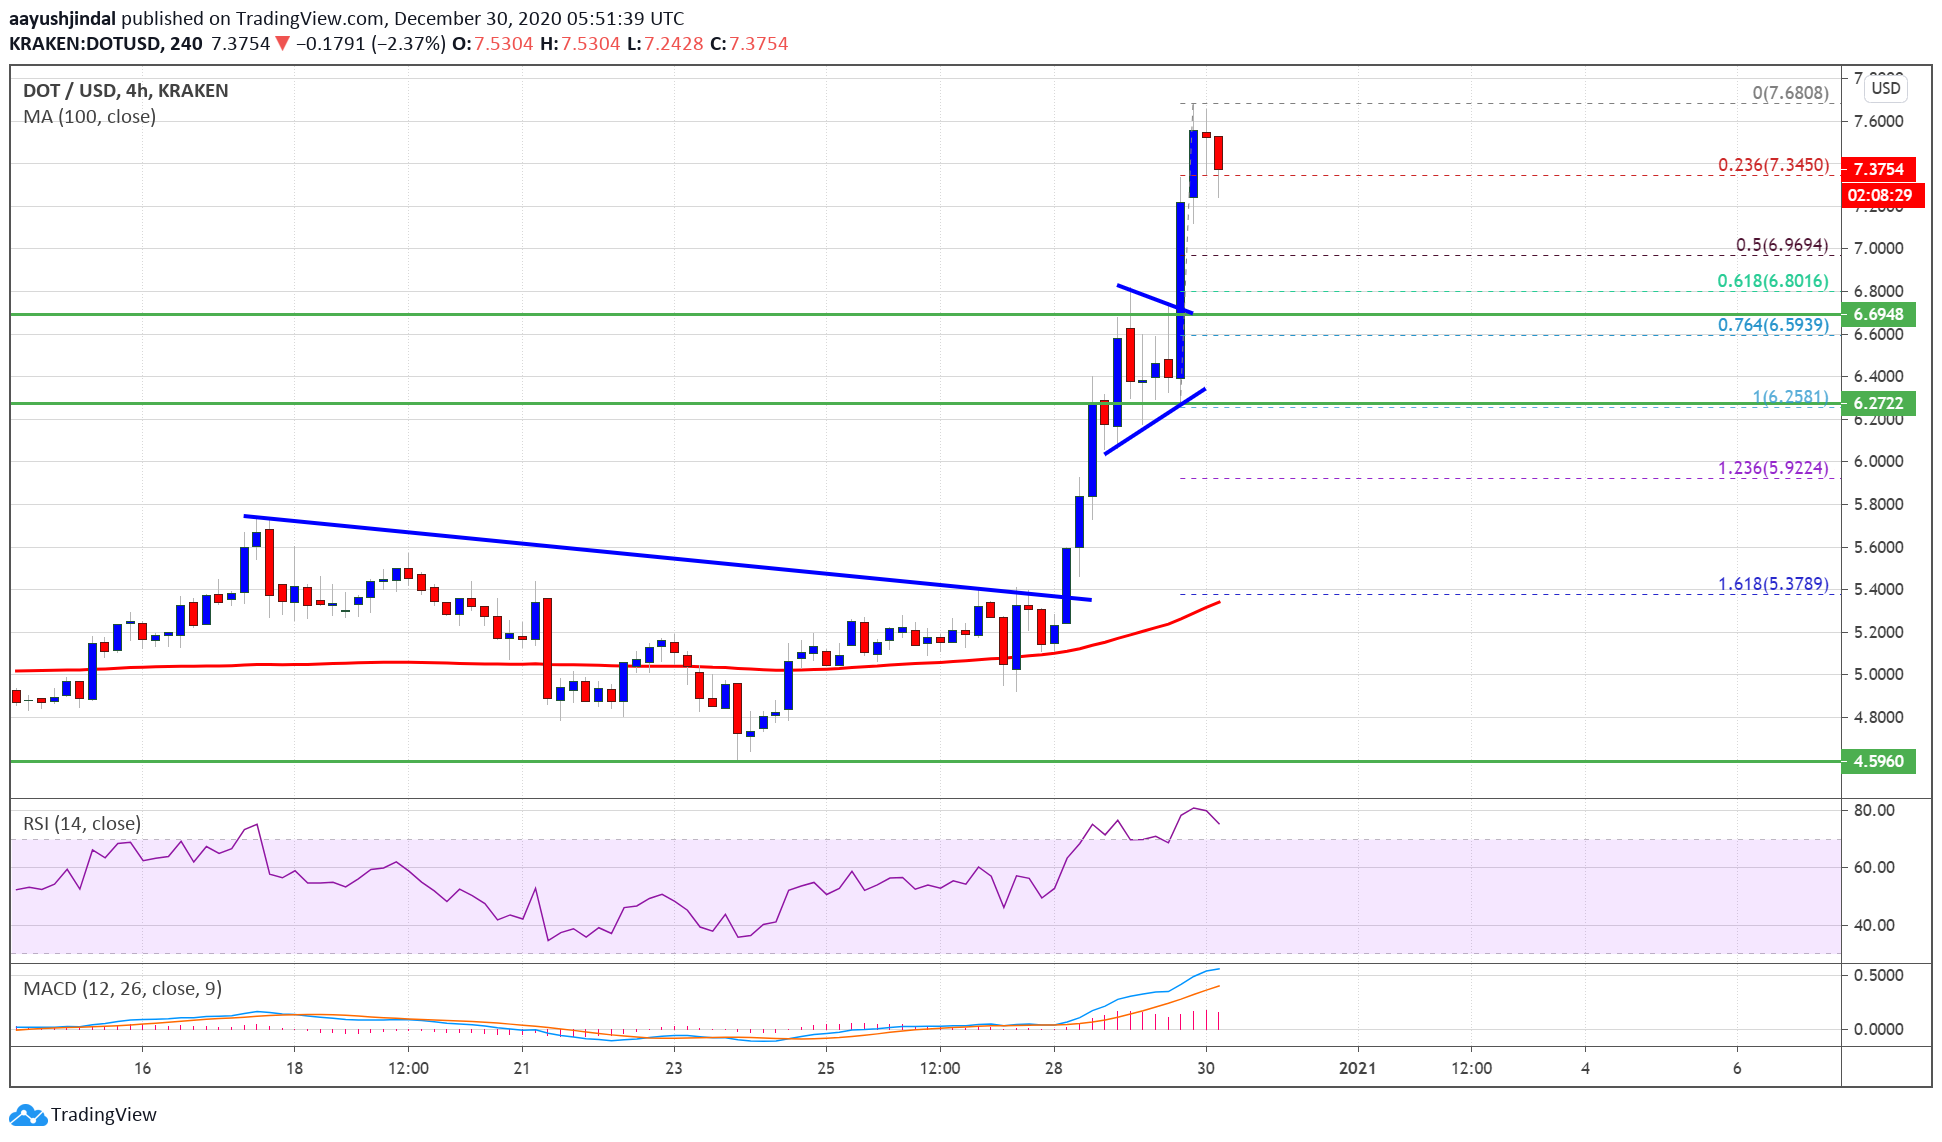
The first major support on the downside is near the $7.00 zone. It is also close to the 50% Fib retracement level of the recent increase from the $6.25 swing low to $7.68 high.
On the upside, the $7.50 and $7.65 levels are important hurdles. A clear break above the $7.65 level could open the doors for a steady increase in the coming days towards $8.00 or $8.20.
Dips Supported?
If DOT price starts a downside correction below $7.20, it could find a strong buying interest near the $7.00 and $6.95 levels in the near term.
The next major support is near the $6.70 level (a multi-touch zone) and the recent breakout zone. Any more losses might call for a test of the $6.25 support zone.
Technical Indicators
4-Hours MACD – The MACD for DOT/USD is gaining momentum in the bullish zone.
4-Hours RSI (Relative Strength Index) – The RSI for DOT/USD is now well above the 60 level.
Major Support Levels – $7.20, $7.00 and $6.95.
Major Resistance Levels – $7.50, $7.65 and $8.00.