
Reason to trust
How Our News is Made
Strict editorial policy that focuses on accuracy, relevance, and impartiality
Ad discliamer
Morbi pretium leo et nisl aliquam mollis. Quisque arcu lorem, ultricies quis pellentesque nec, ullamcorper eu odio.
Dogecoin extended its decline below the $0.070 support against the US Dollar. DOGE could continue to move down towards the $0.0620 support zone.
- DOGE gained pace and traded below the $0.072 support against the US dollar.
- The price is trading below the $0.0700 zone and the 100 simple moving average (4-hours).
- There is a key bearish trend line forming with resistance near $0.0698 on the 4-hours chart of the DOGE/USD pair (data source from Kraken).
- The pair could dive further towards the $0.062 support in the near term.
Dogecoin Price Signals Bearish
In the past few days, dogecoin saw a steady decline from the $0.080 resistance zone. DOGE reacted to the downside below the $0.0750 and $0.0720 support levels.
The decline gained pace below the $0.072 level and the 100 simple moving average (4-hours). More importantly, there was a clear move below the $0.070 support zone, opening the doors for a major decline. The price is now trading well below the $0.0700 zone and the 100 simple moving average (4-hours).
Doge price traded as low as $0.0667 and is currently showing a lot of bearish signs, similar bitcoin and ethereum. On the upside, the price is facing resistance near the $0.0695 level.
The first major resistance is near the $0.0700 level. There is also a key bearish trend line forming with resistance near $0.0698 on the 4-hours chart of the DOGE/USD pair. The trend line is near the 23.6% Fib retracement level of the downward move from the $0.0795 swing high to $0.0667 low.
A clear move above the trend line might send the price towards the $0.073 resistance. It is near the 50% Fib retracement level of the downward move from the $0.0795 swing high to $0.0667 low.
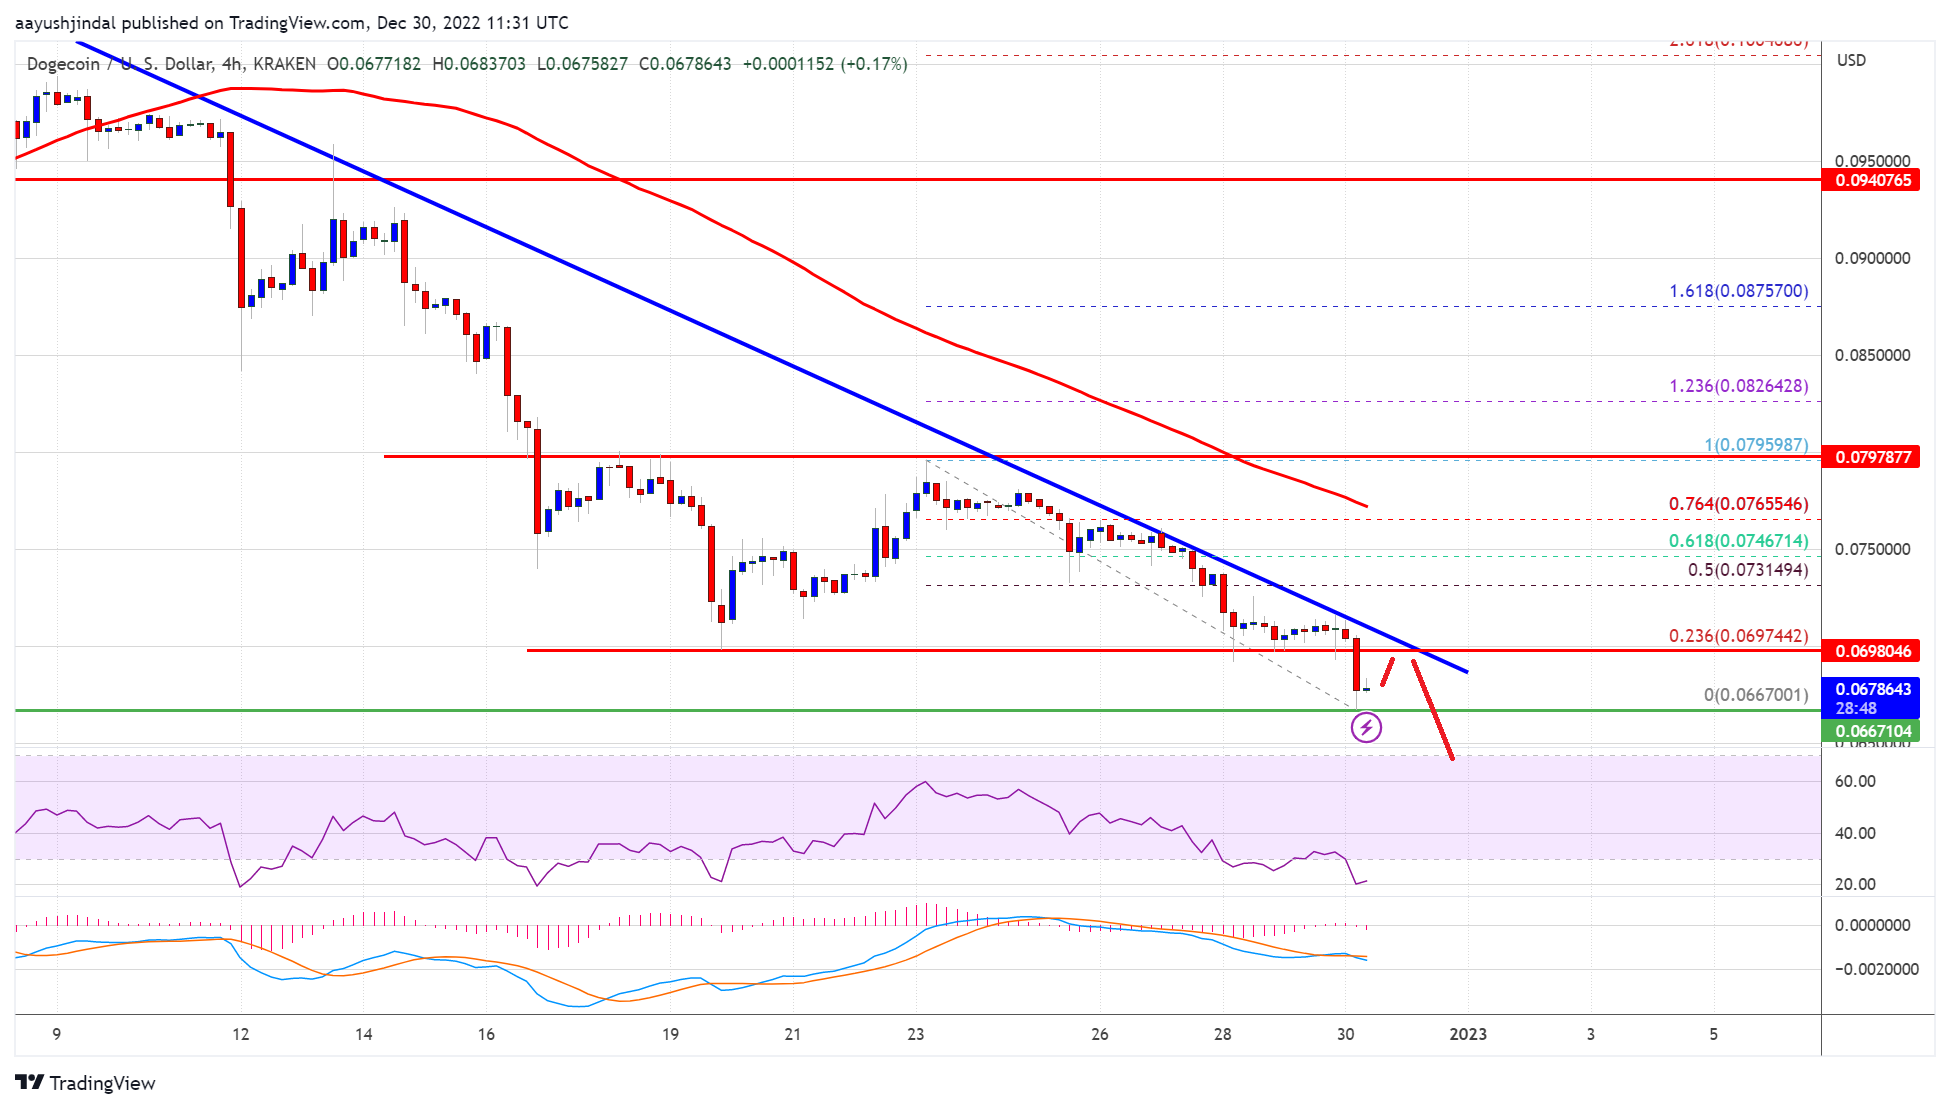
Source: DOGEUSD on TradingView.com
Any more gains might send the price towards the $0.0765 level and the 100 SMA. The main hurdle seems to be forming near the $0.080 zone. A clear move above the $0.080 resistance could open the gates for a rally towards the $0.100 level.
More Losses in DOGE?
If DOGE price fails to gain pace above the $0.070 level, it could continue to move down. An initial support on the downside is near the $0.0665 level.
The next major support is near the $0.062 level. If there is a downside break below the $0.0620 support, the price could decline further. In the stated case, the price might decline towards the $0.060 level.
Technical Indicators
4-Hours MACD – The MACD for DOGE/USD is now gaining momentum in the bearish zone.
4-Hours RSI (Relative Strength Index) – The RSI for DOGE/USD is now in the oversold zone.
Major Support Levels – $0.0665, $0.0662 and $0.0600.
Major Resistance Levels – $0.070, $0.0730 and $0.080.


