
Reason to trust
How Our News is Made
Strict editorial policy that focuses on accuracy, relevance, and impartiality
Ad discliamer
Morbi pretium leo et nisl aliquam mollis. Quisque arcu lorem, ultricies quis pellentesque nec, ullamcorper eu odio.
Dogecoin is showing positive signs above the $0.075 resistance against the US Dollar. DOGE could extend its rally if it breaks the $0.0835 resistance zone.
- DOGE is currently trading in a bullish zone above $0.075 resistance against the US dollar.
- The price is trading well above the $0.0765 zone and the 100 simple moving average (4 hours).
- There is a major bullish trend line forming with support near $0.0760 on the 4-hours chart of the DOGE/USD pair (data source from Kraken).
- The price could start another increase if it clears $0.0820 and $0.0835.
Dogecoin Price Remains In Uptrend
In the last Dogecoin price prediction, we discussed how DOGE rallied over 10%. The price extended its increase above the $0.0820 resistance, outperforming Bitcoin and Ethereum.
Finally, it tested the $0.0840 zone. A high was formed near $0.0837 and recently there was a downside correction. There was a minor decline below the $0.080 level. The price traded below the 23.6% Fib retracement level of the upward move from the $0.0695 swing low to the $0.0837 high.
However, the bulls were active near the $0.0765 support. DOGE is trading well above the $0.0765 zone and the 100 simple moving average (4 hours). There is also a major bullish trend line forming with support near $0.0760 on the 4-hours chart of the DOGE/USD pair.
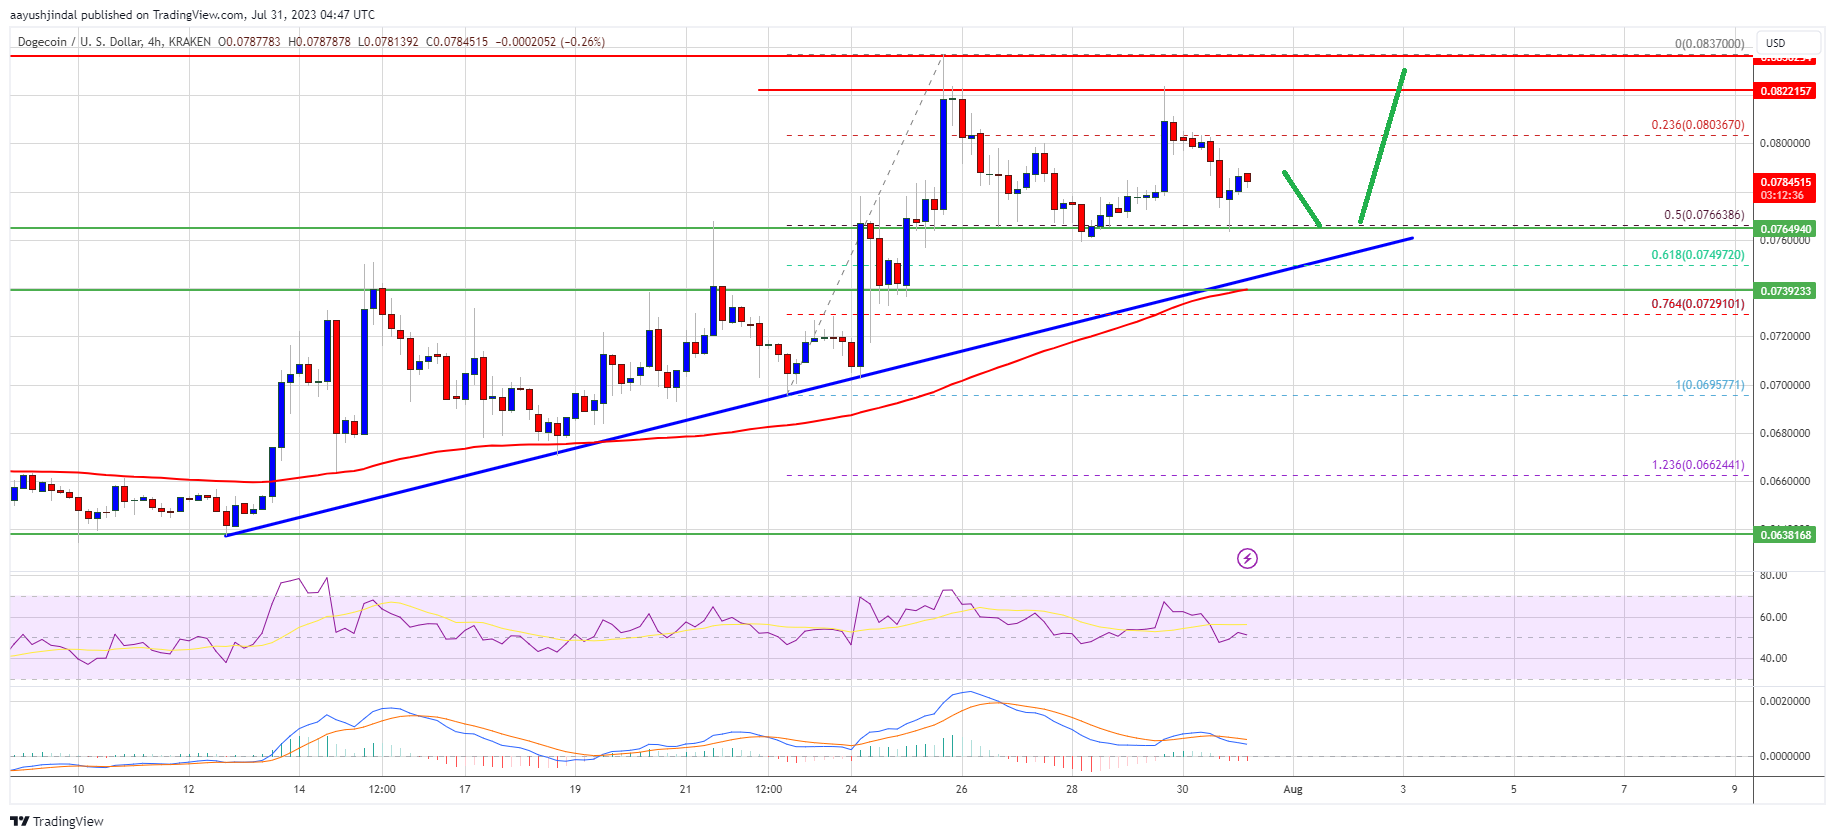
Source: DOGEUSD on TradingView.com
On the upside, the price is facing resistance near the $0.080 level. The first major resistance is near the $0.082 level. A close above the $0.082 resistance might send the price toward the $0.0835 resistance. The next major resistance is near $0.0855. Any more gains might send the price toward the $0.088 level.
Are Dips Limited in DOGE?
If DOGE’s price fails to gain pace above the $0.0820 level, it could continue to move down. Initial support on the downside is near the $0.0765 level.
The next major support is near the $0.0760 level and the trend line. If there is a downside break below the $0.0760 support, the price could decline further. In the stated case, the price might decline toward the $0.070 level.
Technical Indicators
4 Hours MACD – The MACD for DOGE/USD is now losing momentum in the bullish zone.
4 Hours RSI (Relative Strength Index) – The RSI for DOGE/USD is now above the 50 level.
Major Support Levels – $0.0765, $0.0760, and $0.072.
Major Resistance Levels – $0.080, $0.082, and $0.0835.


