
Reason to trust
How Our News is Made
Strict editorial policy that focuses on accuracy, relevance, and impartiality
Ad discliamer
Morbi pretium leo et nisl aliquam mollis. Quisque arcu lorem, ultricies quis pellentesque nec, ullamcorper eu odio.
Ripple is trading in a bearish zone below the $0.2800 resistance against the US Dollar. XRP price could extend its decline below $0.2700 if it fails to surpass $0.2800.
- Ripple is currently declining and trading well below the $0.2800 resistance against the US dollar.
- The price is approaching the $0.2730 and $0.2710 support levels.
- There is a significant bearish trend line forming with resistance near $0.2765 on the hourly chart of the XRP/USD pair (data source from Kraken).
- The pair could either start a real recovery above $0.2800 or decline sharply below $0.2700.
Ripple Price Near Inflection Point
Ripple price failed to stay above the $0.2840 support and extended its decline. XRP broke the $0.2800 support level and the 100 hourly simple moving average to move further into a bearish zone.
It traded to a new weekly low at $0.2710 and recently started an upside correction. However, the upward move was capped by the $0.2800 level (support turned resistance). A high is formed near $0.2810 and the price is currently declining.
There was a break below the $0.2780 and $0.2760 levels. Ripple is now trading near the 61.8% Fib retracement level of the recent recovery from the $0.2710 low to $0.2810 high.
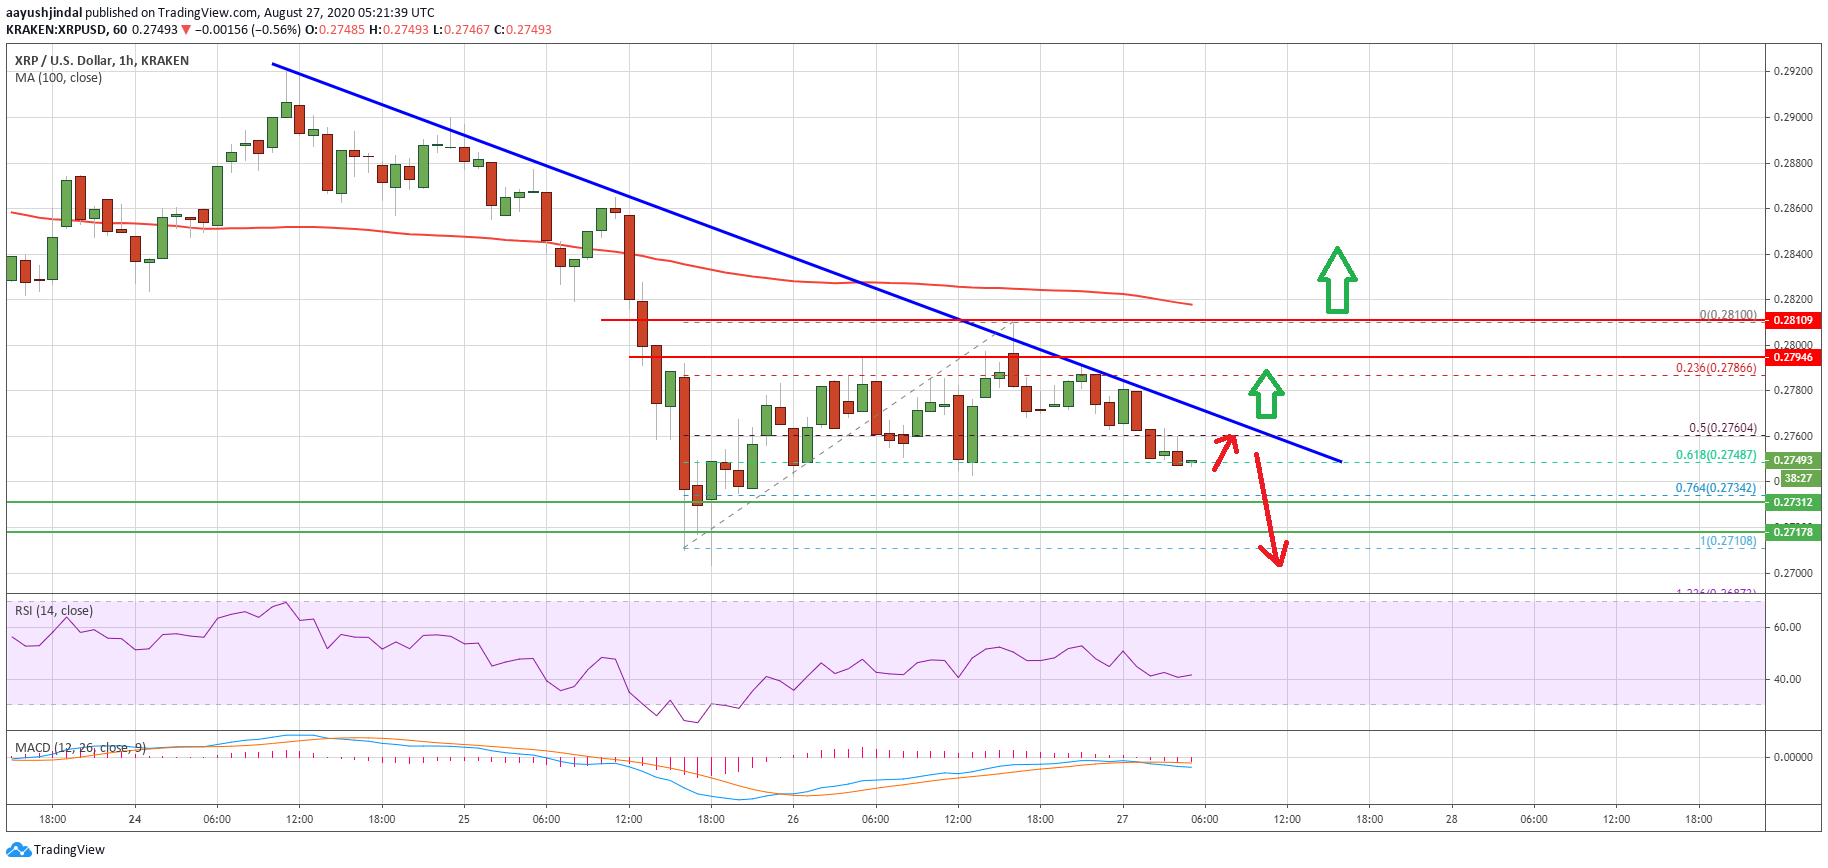
Ripple price trades below $0.2800. Source: TradingView.com
It seems like there is a significant bearish trend line forming with resistance near $0.2765 on the hourly chart of the XRP/USD pair. To move into a positive zone, the price must break the trend line resistance at $0.2765.
The main hurdle is still near $0.2800 and the 100 hourly SMA, above which the price could start a sustained upward move. The next resistance might be $0.2880 and $0.2900, followed by the key $0.2920 pivot level.
Bearish Break in XRP?
If ripple struggles to clear above the trend line resistance and $0.2800, there is a risk of a bearish break below the $0.2730 and $0.2710 support levels in the near term.
The next major support is near the $0.2680 level, below which the price could dive towards the $0.2620 and $0.2600 levels. Any further losses are likely to lead the price towards the $0.2550 level.
Technical Indicators
Hourly MACD – The MACD for XRP/USD is now gaining pace in the bearish zone.
Hourly RSI (Relative Strength Index) – The RSI for XRP/USD is declining and it is well below the 50 level.
Major Support Levels – $0.2730, $0.2710 and $0.2620.
Major Resistance Levels – $0.2765, $0.2800 and $0.2840.


