
Reason to trust
How Our News is Made
Strict editorial policy that focuses on accuracy, relevance, and impartiality
Ad discliamer
Morbi pretium leo et nisl aliquam mollis. Quisque arcu lorem, ultricies quis pellentesque nec, ullamcorper eu odio.
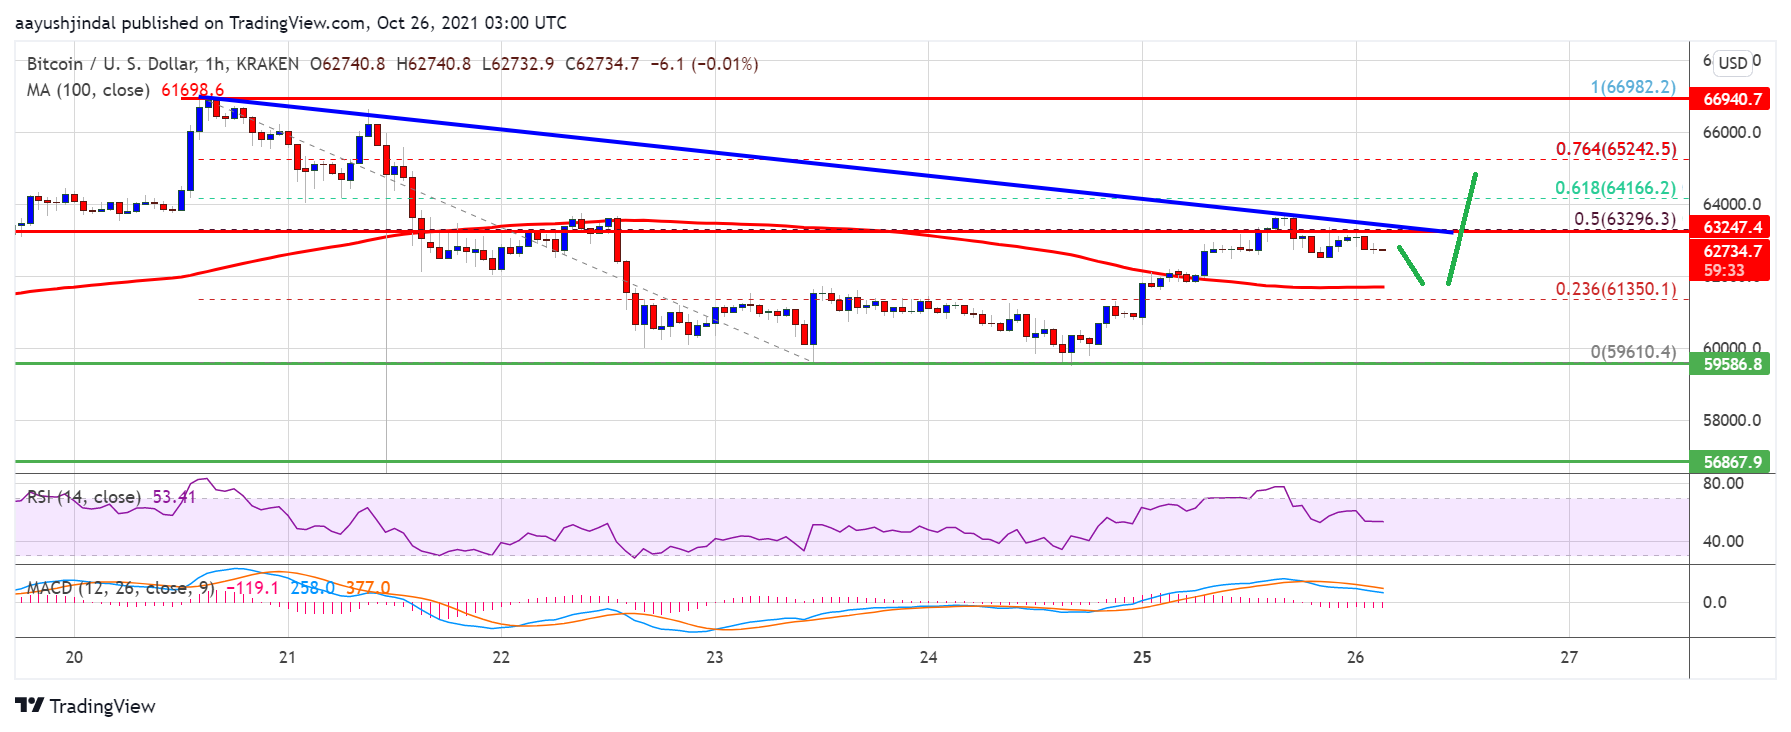
Bitcoin price started a fresh increase from $60,000 against the US Dollar. BTC is back above $62,000, but it must clear $64,000 for hopes of a fresh rally.
- Bitcoin recovered losses and was able to climb above the $62,500 resistance.
- The price is now trading above $62,000 and the 100 hourly simple moving average.
- There is a major bearish trend line forming with resistance near $63,200 on the hourly chart of the BTC/USD pair (data feed from Kraken).
- The pair could start a steady increase if there is a close above the $64,000 resistance zone.
Bitcoin Price Eyes Fresh Rally
Bitcoin price dipped below the $60,000 level, but downsides were limited. BTC traded as low as $59,610 before starting a fresh increase. The price was able to rise above the $61,000 and $61,200 resistance levels.
There was a recovery wave above the $62,000 and $62,500 levels. Bitcoin even spiked above the 50% Fib retracement level of the downward move from the $66,980 swing high to $59,610 low. The price is now trading above $62,000 and the 100 hourly simple moving average.
It is currently facing resistance near the $63,000 and $63,200 levels. There is also a major bearish trend line forming with resistance near $63,200 on the hourly chart of the BTC/USD pair.
The main breakout resistance is now forming near the $64,000 level. It is near the 61.8% Fib retracement level of the downward move from the $66,980 swing high to $59,610 low.
Source: BTCUSD on TradingView.com
A clear break above the trend line resistance and then $64,000 may possibly call open the doors for a move towards the $65,000 level. The next major resistance sits near the $66,500 level.
Fresh Decline In BTC?
If bitcoin fails to clear the $64,000 resistance zone, it could start a fresh downside correction. An immediate support on the downside is near the $62,200 level.
The first major support is now forming near the $61,500 level and the 100 hourly SMA. A break below the $61,500 support may possibly push the price towards the $60,000 support zone in the near term.
Technical indicators:
Hourly MACD – The MACD is slowly gaining pace in the bullish zone.
Hourly RSI (Relative Strength Index) – The RSI for BTC/USD is now above the 50 level.
Major Support Levels – $62,200, followed by $61,500.
Major Resistance Levels – $63,000, $63,200 and $64,000.