
Reason to trust
How Our News is Made
Strict editorial policy that focuses on accuracy, relevance, and impartiality
Ad discliamer
Morbi pretium leo et nisl aliquam mollis. Quisque arcu lorem, ultricies quis pellentesque nec, ullamcorper eu odio.
Bitcoin price corrected lower, but it remained well bid above $32,000 against the US Dollar. BTC is currently rising, but it must clear the $34,000 resistance for a steady increase.
- Bitcoin is slowly gaining momentum above the $33,000 and $33,200 resistance levels.
- The price is currently trading above the $33,500 level and the 100 hourly simple moving average.
- There is a major declining channel forming with resistance near $34,000 on the hourly chart of the BTC/USD pair (data feed from Kraken).
- The pair could start a strong upward move if it clears the $34,000 resistance level.
Bitcoin Price Is Showing Recovery Signs
There was a downside extension in bitcoin price below the $33,200 support level. BTC even broke the $32,500 support level and the 100 hourly simple moving average. However, the bulls were able to protect the $32,000 support zone.
A low is formed near $32,178 and the price is currently rising. It broke the $32,500 and $33,000 resistance levels. There was also a break above the 23.6% Fib retracement level of the downward move from the $38,612 high to $32,178 low.
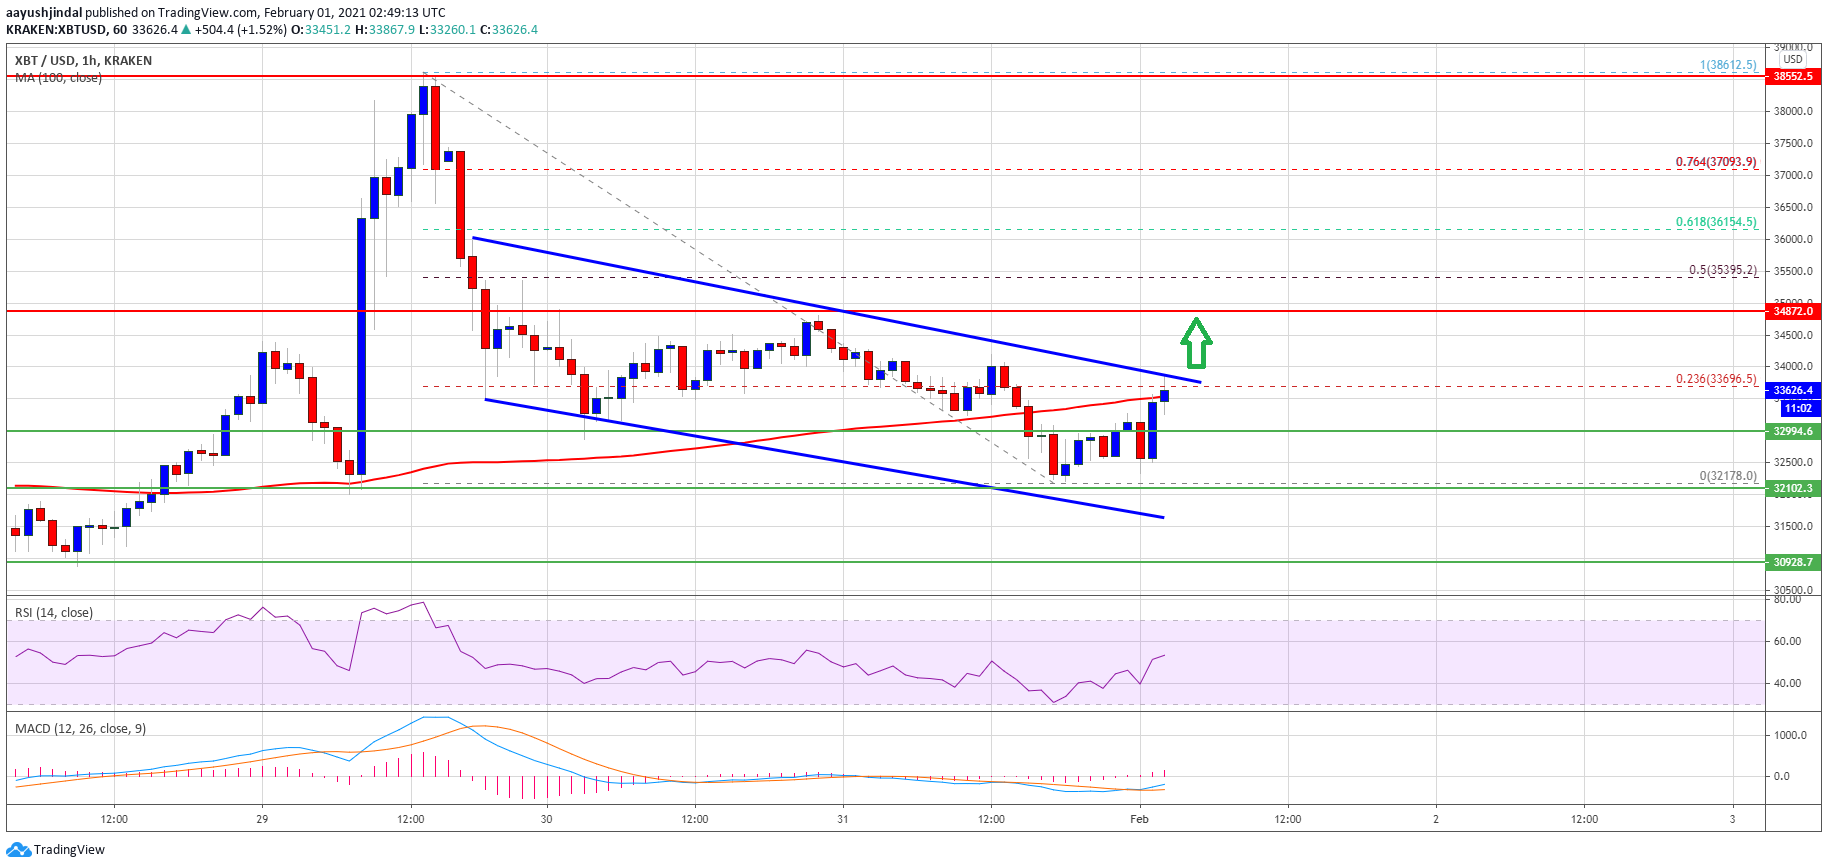
Source: BTCUSD on TradingView.com
Bitcoin price is now trading above the $33,500 level and the 100 hourly simple moving average. It is testing the key $34,000 resistance zone. There is also a major declining channel forming with resistance near $34,000 on the hourly chart of the BTC/USD pair.
The channel resistance is close to the 50% Fib retracement level of the downward move from the $38,612 high to $32,178 low. A successful break above the $34,000 resistance level could open the doors for a larger increase in the coming sessions. The next major resistance sits at $35,400, followed by $36,200.
Fresh Dip in BTC?
If bitcoin fails to clear the $34,000 resistance zone, there is a risk of a fresh decline. An initial support is near the $33,000 level. The next major support is near the $32,200 level.
Any more losses could lead the price towards the channel lower trend line at $31,500. If the price fails to stay inside the channel, it could easily dive towards the $30,000 support zone.
Technical indicators:
Hourly MACD – The MACD is slowly gaining pace in the bullish zone.
Hourly RSI (Relative Strength Index) – The RSI for BTC/USD is now above the 50 level.
Major Support Levels – $33,000, followed by $32,200.
Major Resistance Levels – $34,000, $35,000 and $35,400.


