
Reason to trust
How Our News is Made
Strict editorial policy that focuses on accuracy, relevance, and impartiality
Ad discliamer
Morbi pretium leo et nisl aliquam mollis. Quisque arcu lorem, ultricies quis pellentesque nec, ullamcorper eu odio.
Bitcoin price made another attempt to gain momentum above $13,200 against the US Dollar, but failed. BTC is likely to react to the downside if it continues to struggle near $13,200 and $13,300.
- Bitcoin corrected lower below $13,000, but it found support near $12,800.
- The price is back above the $13,000 zone and the 100 hourly simple moving average.
- There is a key bullish trend line forming with support near $12,880 on the hourly chart of the BTC/USD pair (data feed from Kraken).
- The pair must gain strength above $13,200 to continue higher towards $13,500 in the near term.
Bitcoin Price is Lacking Momentum
Bitcoin price failed to stay above the $13,200 zone and started a downside correction. BTC broke the $13,100 and $13,000 levels, but the bulls were able to defend the $12,800 region.
A low is formed near $12,790 and the price is currently rising. It is back above the $13,000 zone and the 100 hourly simple moving average. There was a break above the 50% Fib retracement level of the recent drop from the $13,247 high to $12,790 low.
On the upside, the $13,150 level is an initial hurdle for the bulls. It is close to the 76.4% Fib retracement level of the recent drop from the $13,247 high to $12,790 low. There is also a connecting bearish trend line forming with resistance near $13,200 on the hourly chart of the BTC/USD pair.
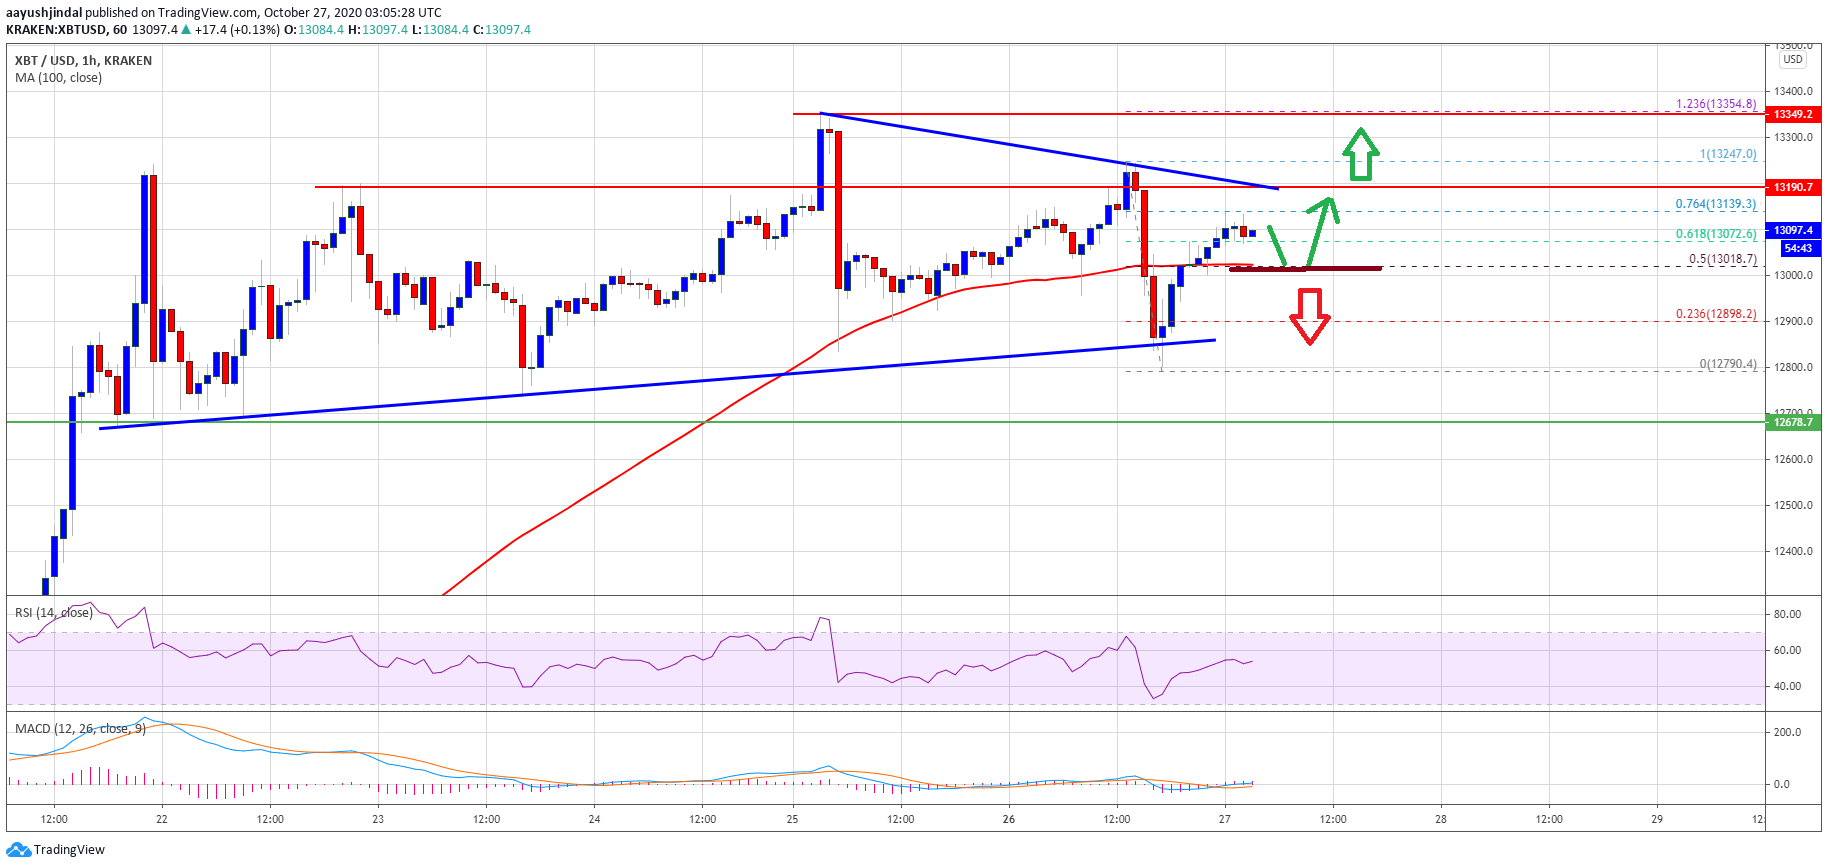
Source: BTCUSD on TradingView.com
Bitcoin price must clear the $13,200 resistance and gain momentum to continue higher. The next major resistance on the upside is near the $13,300 level, above which the price might test $13,500.
Bearish Reaction in BTC?
If bitcoin fails to climb above the trend line and the $13,200 resistance zone, there could be a bearish reaction. An initial support is near the $13,000 zone and the 100 hourly simple moving average.
A downside break below the 100 hourly SMA could lead the price towards the $12,800 support. There is also a key bullish trend line forming with support near $12,880 on the same chart. A clear break below the trend line support could open the doors for a larger decline in the coming sessions.
Technical indicators:
Hourly MACD – The MACD is struggling to gain momentum in the bullish zone.
Hourly RSI (Relative Strength Index) – The RSI for BTC/USD is still above the 50 level, with positive signs.
Major Support Levels – $13,000, followed by $12,800.
Major Resistance Levels – $13,150, $13,200 and $13,500.


