
Reason to trust
How Our News is Made
Strict editorial policy that focuses on accuracy, relevance, and impartiality
Ad discliamer
Morbi pretium leo et nisl aliquam mollis. Quisque arcu lorem, ultricies quis pellentesque nec, ullamcorper eu odio.
Bitcoin price is currently facing resistance near $58,250 and $58,500 against the US Dollar. BTC could dip in the short-term, but the bulls are likely to remain active near $57,000.
- Bitcoin recovered above $57,500, but it is facing resistance near $58,250.
- The price is still trading well below $58,500 and the 100 hourly simple moving average.
- There is a key bearish trend line forming with resistance near $58,600 on the hourly chart of the BTC/USD pair (data feed from Kraken).
- The pair could dip again, but the bulls are likely to remain active near $57,000.
Bitcoin Price is Facing Hurdles
Bitcoin remained well bid above the $56,500 support zone. As a result, BTC started a fresh increase above the $57,000 and $57,250 resistance levels.
The price even cleared the 23.6% Fib retracement level of the recent drop from the $59,872 high to $56,488 low. However, the price seems to be facing a strong resistance near the $58,250 and $58,500 levels.
It is now trading well below $58,500 and the 100 hourly simple moving average. An immediate resistance is near the $58,180 level. It is near the 50% Fib retracement level of the recent drop from the $59,872 high to $56,488 low.
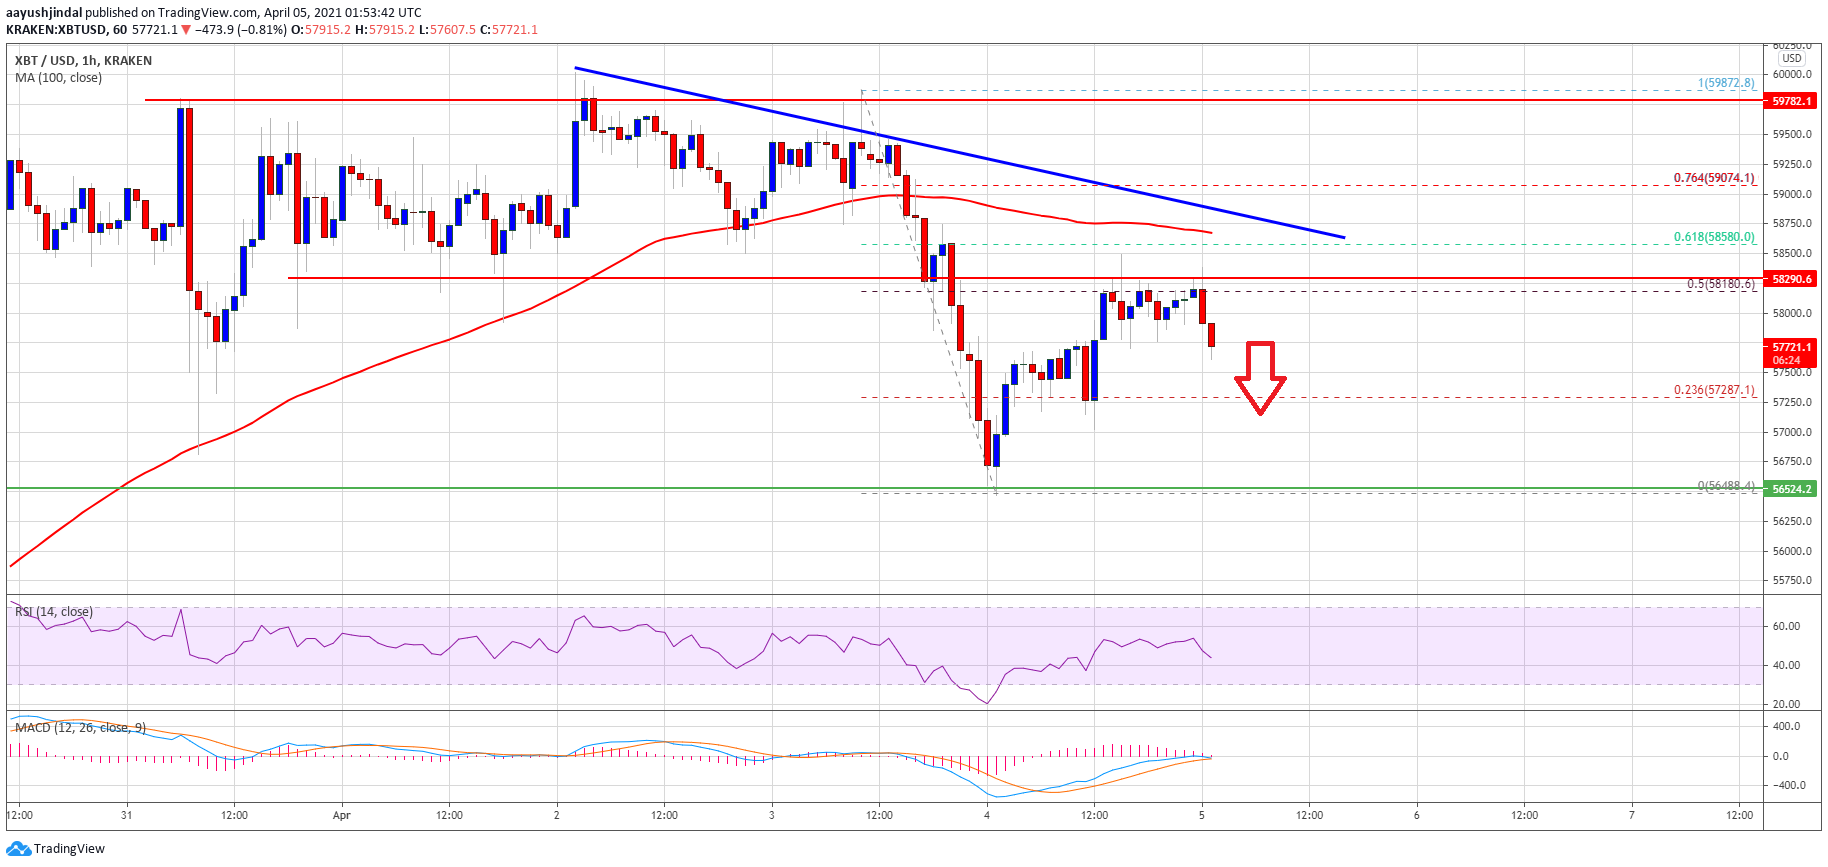
Source: BTCUSD on TradingView.com
The main resistance is forming near the $58,500 level (a multi-touch zone). There is also a key bearish trend line forming with resistance near $58,600 on the hourly chart of the BTC/USD pair.
If there is an upside break above the $58,250 and $58,500 resistance levels, there are chances of a steady increase. In the stated case, bitcoin price is likely to rise towards the $60,000 and $60,500 levels.
Dips Limited in BTC?
If bitcoin fails to climb above $58,250 and $58,500, there could be a downside correction. The first major support on the downside is near the $57,500 level.
The next major support is near the $57,150 level, below which the price might decline towards the main $56,500 support zone. If there is a downside break below the $56,500 support level, the bulls are likely to lose control. In this case, the bears are likely to aim a test of the $55,000 level.
Technical indicators:
Hourly MACD – The MACD is slowly gaining momentum in the bearish zone.
Hourly RSI (Relative Strength Index) – The RSI for BTC/USD is now below the 50 level.
Major Support Levels – $57,000, followed by $56,500.
Major Resistance Levels – $58,180, $58,250 and $58,500.