
Reason to trust
How Our News is Made
Strict editorial policy that focuses on accuracy, relevance, and impartiality
Ad discliamer
Morbi pretium leo et nisl aliquam mollis. Quisque arcu lorem, ultricies quis pellentesque nec, ullamcorper eu odio.
Bitcoin broke the $65,000 resistance and traded to a new all-time high against the US Dollar. BTC is correcting gains, but dips could remain attractive near $63,000.
- Bitcoin gained pace above the $65,000 and $65,500 resistance levels.
- The price is now trading above $63,000 and the 100 hourly simple moving average.
- There is a crucial bullish trend line forming with support near $63,000 on the hourly chart of the BTC/USD pair (data feed from Kraken).
- The pair is correcting gains, but dips might remain limited below $62,000 in the near term.
Bitcoin Price Remains In Uptrend
Bitcoin price extended its increase above the $63,500 resistance zone. BTC broke the key $65,000 resistance zone and settled above the 100 hourly simple moving average.
It even spiked above the $65,500 resistance and traded to a new all-time high at $66,982. It is currently correcting lower and trading below the $66,000 level. There was a break below the 23.6% Fib retracement level of the upward wave from the $61,320 swing low to $66,982 high.
An immediate support is near the $64,200 level. There is also a crucial bullish trend line forming with support near $63,000 on the hourly chart of the BTC/USD pair.
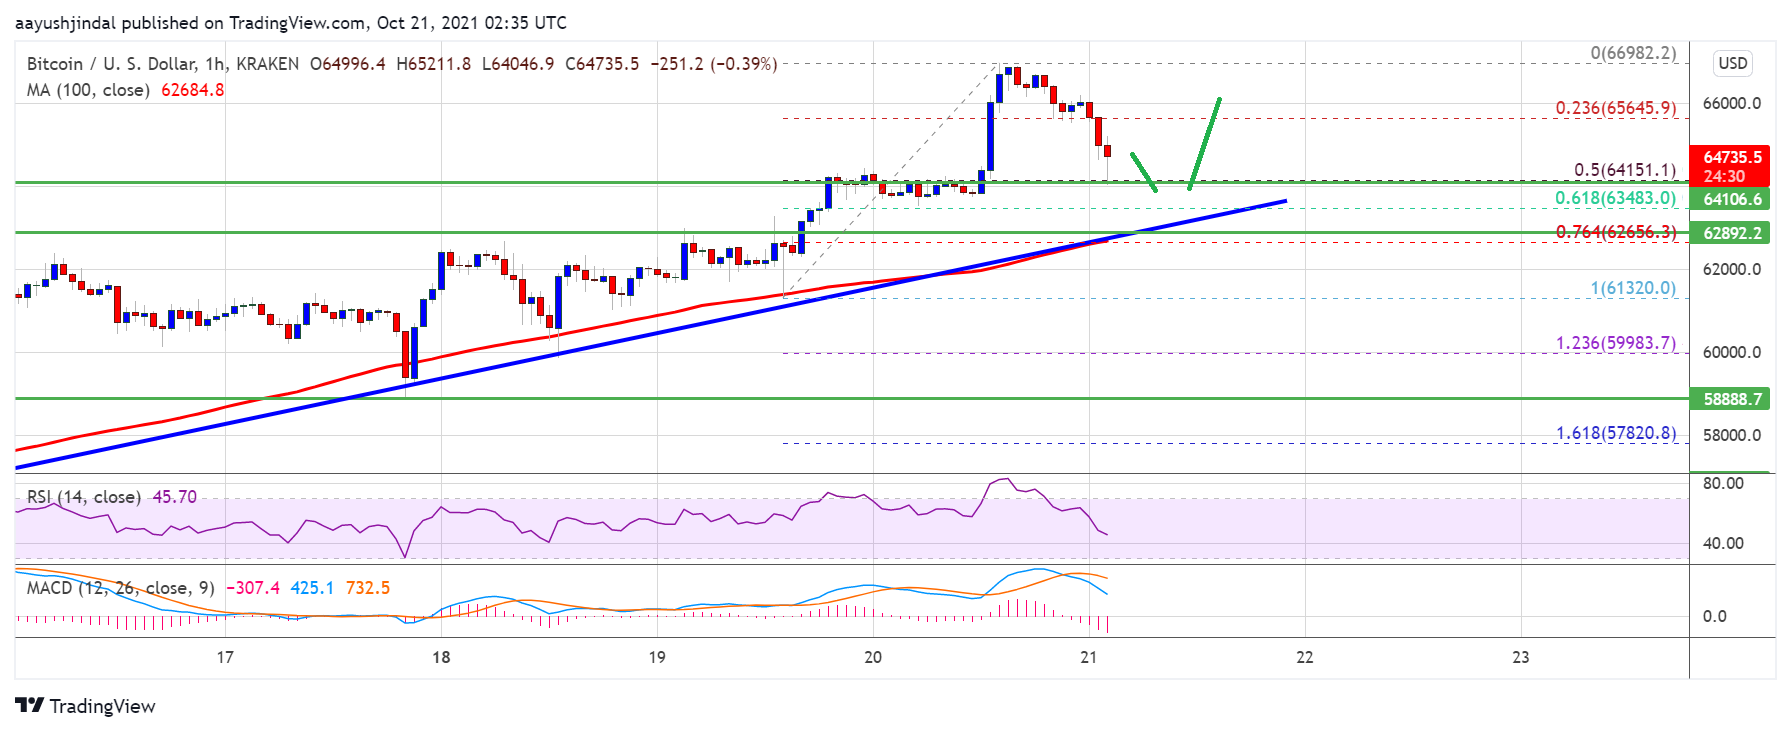
Source: BTCUSD on TradingView.com
On the upside, an initial resistance is near the $65,200 level. The first key resistance is near the $65,500 level. A clear break above the $65,500 resistance could open the doors for more upsides. The next major resistance sits near the $66,800 level, above which the price might rise towards the $68,000 level. Any more gains could lead the price towards the $68,000 level.
Dips Supported In BTC?
If bitcoin fails to clear the $65,500 resistance zone, it could extend its downside correction. An immediate support on the downside is near the $64,200 level.
The first major support is now forming near the $64,150 level. It is near the 50% Fib retracement level of the upward wave from the $61,320 swing low to $66,982 high. The main support is near the trend line and $63,400, below which the price might decline towards the $63,000 support and the 100 hourly SMA.
Technical indicators:
Hourly MACD – The MACD is now losing pace in the bullish zone.
Hourly RSI (Relative Strength Index) – The RSI for BTC/USD is now below the 50 level.
Major Support Levels – $64,150, followed by $63,400.
Major Resistance Levels – $65,500, $66,800 and $68,000.