Reason to trust

How Our News is Made
Strict editorial policy that focuses on accuracy, relevance, and impartiality
Ad discliamer
Morbi pretium leo et nisl aliquam mollis. Quisque arcu lorem, ultricies quis pellentesque nec, ullamcorper eu odio.
Bitcoin price action is back in the low $30,000 range, after another failed attempt to reach $40,000 over the Father’s Day weekend. The effort from bulls is getting weaker and weaker, even now resulting in a “death cross” on daily timeframes. But could they be simply feigning weakness, ready to squeeze short traders and push prices back higher in a flash?
The stage is set well, so much so, the price action and several key technical indicators are closely mimicking the behavior right around one of the greatest pumps in Bitcoin history. Is that what’s to come in the days ahead?
Is The Bitcoin Bull Cycle Finished Or Is This Simple Consolidation?
Markets are cyclical and trends can stretch across years, to months, to weeks and even days. Technical analysts seek out the earliest signs of a trend and aim to capitalize on that trend as long as they can.
The Bitcoin uptrend from the Black Thursday low has clearly come to an end, and there’s now confusion in the market around if a downtrend is beginning, or if the more dominant primary uptrend stays intact.
Related Reading | The Missing Ingredient From A Full On Bitcoin Reversal
If the greater bull market is now over for Bitcoin, it is among the shortest in its history. Analysts have expected cycles to be lengthening, which adds credence to the theory the bull cycle isn’t yet broken.
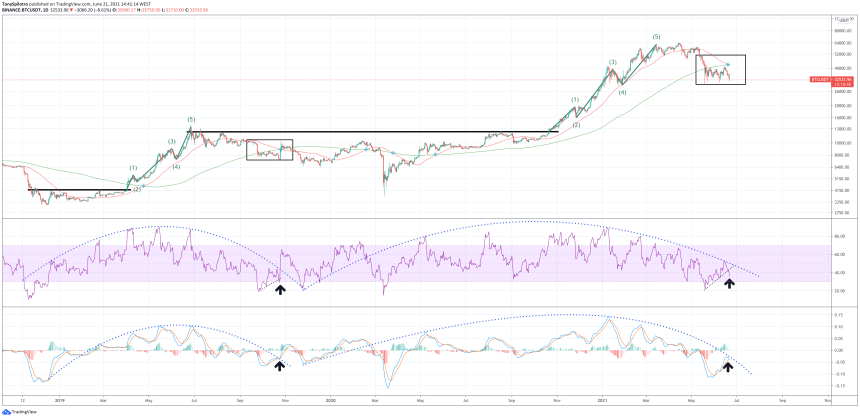
Instead, price action in the top cryptocurrency appears to be instead mimicking the technical patterns following the last major top, back in June 2019.

Multiple signals match the last major post-rally death cross | Source: BTCUSD on TradingView.com
Fractal Offers Several Technical Factors To Support Record-Breaking Reversal Rally
After Bitcoin price broke down from its June 2019 top, there was a sharp downward move followed by consolidation. The same thing is playing out again now, and while that’s not enough to pay much attention to, the fact several trading indicators are showing a similar setup could be telling of what’s to come next.
Each major top since the bear market bottom followed the completion of a five-wave impulse based on Elliott Wave Principle. On the way back down, the RSI and LMACD made several lower peaks and troughs, following a curved downtrend resistance line.
Related Reading | Why Bitcoin Could Slingshot Back To Lows Before Gaining Momentum
Both instances also had a death cross on the daily, which turned into a history-making pump the last time the setup was there. Much like last time around, the daily RSI support was lost resulting in another push lower and forming a bullish divergence on the price chart.
The last time around, the LMACD also crossed down temporarily for just one daily close, followed by an explosive move up to above the death cross – a more than 40% move across two days.
A similar rally in Bitcoin percentage wise, would send the cryptocurrency back above $45,000 and hurdling toward $50,000 resistance. Making it back above that level would confirm the bull market is still on, while another crash deeper cannot be ruled out.
Even a far deeper correction, according to Elliott Wave, could go as low as $14,000 and the bull market could remain unbroken.
Featured image from iStock Photos, Charts from TradingView.com


