Reason to trust

How Our News is Made
Strict editorial policy that focuses on accuracy, relevance, and impartiality
Ad discliamer
Morbi pretium leo et nisl aliquam mollis. Quisque arcu lorem, ultricies quis pellentesque nec, ullamcorper eu odio.
Bitcoin broke through support and plunged to the lowest prices seen since 2020. However, despite all the fear the drop has caused, it could be the last low before the top cryptocurrency continues its bull run.
Here is why an extremely rare Elliott Wave expanding triangle pattern could be the last hope Bitcoin bulls have for new highs before a bear market.
Ralph Nelson Elliott And His Theory On How Markets Move
Ask most crypto investors and they would probably agree: we are in a bear market. However, based on the guidelines of Elliott Wave Theory, the last year and a half of mostly sideways could be part of one powerful, confusing, and rare corrective pattern.
Related Reading | One Coin, Two Trades: Why Bitcoin Futures And Spot Signals Don’t Match Up
Elliott Wave Principle was first discovered by Ralph Nelson Elliott in the 1930s. The theory believes all markets move in the direction of the primary trend in the same five-wave pattern. Odd-numbered waves move up with the primary trend as well, while even-numbered waves are corrective in nature that move against the trend.

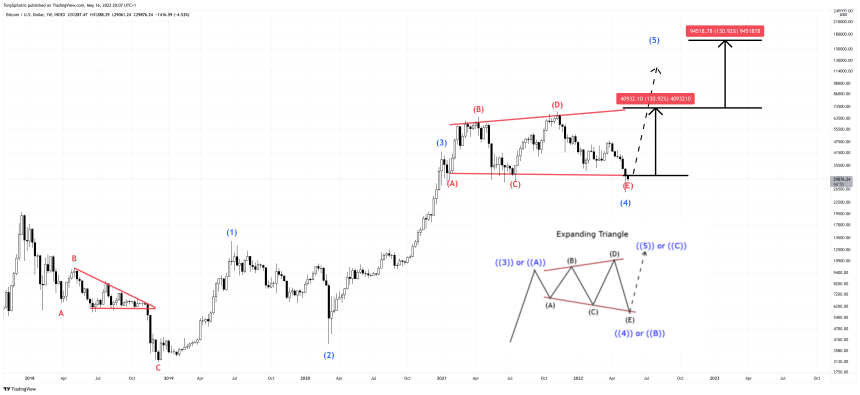
Is Bitcoin trading in an expanding triangle? | Source: BTCUSD on TradingView.com
In the chart above, BTCUSD could potentially be trading in an expanding triangle. In Elliott Wave Theory, triangles of any kind only appear immediately preceding the final move of a sequence. During the bear market, a triangle appeared in place of the B wave before breaking down to the bear market bottom.
Identifying A Bullish Expanding Triangle Pattern
Triangles can contract, expand, descend, ascend, and even take on some “irregular” shapes. The expanding triangle pictured above and below should in theory only occur before the final wave five impulse up. If that’s the case, the bull run could continue once the bottom of the E wave is put in.

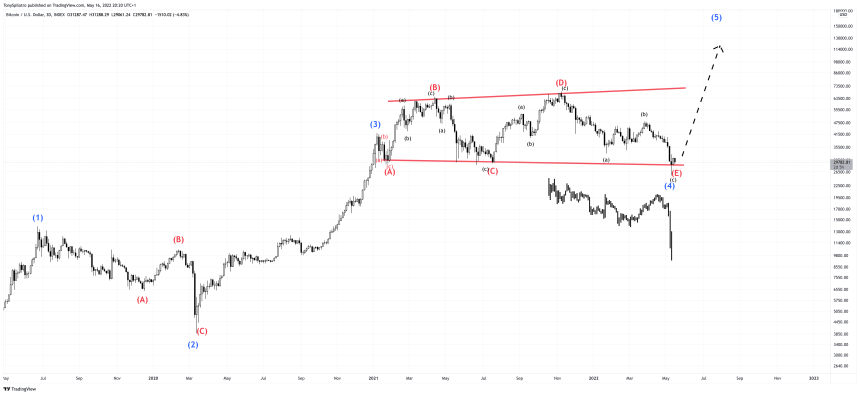
Each subwave is a Zig-zag similar to wave two | Source: BTCUSD on TradingView.com
An expanding triangle is characterized as having five waves that sub-divide into ABCDE corrections. Waves A, C, and E are against the primary trend, while B and D waves are with the primary trend. Each sub-wave further sub-divides into three-wave patterns called a Zig-zag. Zig-zag patterns are sharper, and more commonly appear in wave two corrections.
The fact that an expanding triangle has five of these brutal corrections in two different directions makes it especially confusing and frustrating. Expanding triangles only form under the most unusual market conditions.
Related Reading | Bitcoin Bear Market Comparison Says It Is Almost Time For Bull Season
Extreme uncertainty drives expansive volatility in both directions. Both sides of the trade are repeatedly stopped out of trades, adding to frustration. By the end of the pattern, order books are thin and easily overpowered. Decidedly bearish sentiment squeezes prices up quickly causing an upward breakout of the pattern and continuation of the bull run. The chase and FOMO creates the conditions necessary for wave five.
Why Bitcoin Could Still Have Wave Five Ahead
The only problem is that there is no telling if this is the correct pattern, or if Bitcoin is in (or possibly just completed) a wave four according to Elliott Wave Theory. Knowing that triangles only appear before the final move of a sequence helps improve the changes of this expanding triangle being valid. However, it is more important to understand the characteristics of each wave.
Corrective waves result in ABC or ABCDE corrections (along with some more complex corrections) that move against the primary trend. Between corrections is an impulse wave up, in a five-wave stair-stepping pattern. After the bear market bottom, a new trend emerges starting with wave one. Wave two is often a sharp, Zig-zag style correction that retraces most of wave one.

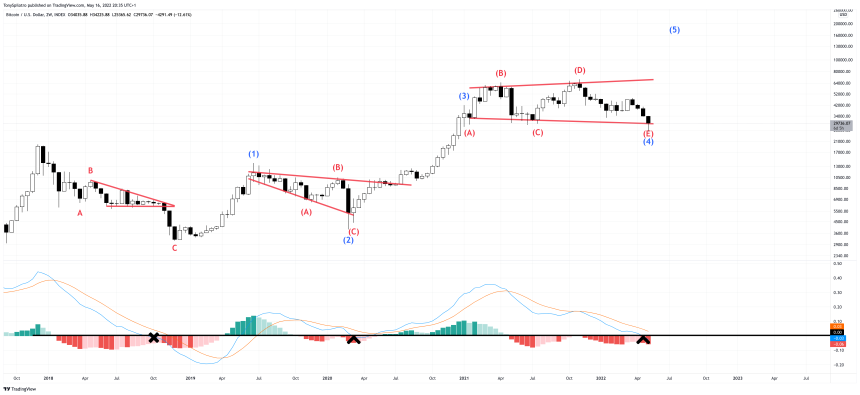
A bear market will move below the zero line on the MACD | Source: BTCUSD on TradingView.com
The lack of a new low creates the confidence for more market participants to join, making wave three the most powerful and extended of all. Wave four typically moves sideways and lacks the same severity of the wave two correction. Elliott said that wave four represents hesitancy in the market before finishing the trend. Both wave two and wave four tend to bring the MACD back down to the zero line before reversing higher – a setup clearly depicted above.
Related Reading | Bitcoin Indicator Hits Historical Low Not Seen Since 2015
When the hesitancy ends, wave five typically matches the length and magnitude of wave one. But after such a long and nasty wave four correction, any wave five has the potential to extend similar to wave three. If this were the case, the expanding triangle pattern created the perfect shakeout of both sides of the market.
Here is a 🧵 on my full Elliott Wave analysis on #Bitcoin and why I don’t believe there is a bear market – and why I expect the last leg up any day now.
— Tony "The Bull" Severino, CMT (@tonythebullBTC) May 15, 2022
Follow @TonySpilotroBTC on Twitter or join the TonyTradesBTC Telegram for exclusive daily market insights and technical analysis education. Please note: Content is educational and should not be considered investment advice.
Featured image from iStockPhoto, Charts from TradingView.com


