
Reason to trust
How Our News is Made
Strict editorial policy that focuses on accuracy, relevance, and impartiality
Ad discliamer
Morbi pretium leo et nisl aliquam mollis. Quisque arcu lorem, ultricies quis pellentesque nec, ullamcorper eu odio.
Bitcoin price declined more than 5% and broke many supports near $18,500 against the US Dollar. BTC could correct higher, but upsides might face hurdles near $18,600.
- Bitcoin started a fresh decline after it failed to stay above the $19,000 support.
- The price traded close to the $18,000 support and settled below the 100 hourly simple moving average.
- There is a short-term contracting triangle forming with resistance near $18,320 on the hourly chart of the BTC/USD pair (data feed from Kraken).
- The pair could correct higher, but the previous support at $18,500 and $18,600 might stop upsides.
Bitcoin Price is Correcting Gains
After many failed attempts to surpass $19,500 and $19,600, bitcoin price reacted to the downside. BTC broke the $19,000 support and settled below the 100 hourly simple moving average to move into a short-term bearish zone.
The price gained pace after it broke the key $18,600 and $18,500 support levels. The bears gained strength and they managed to push the price towards the $18,000 zone. A low is formed near $18,033 and the price is currently consolidating losses.
An initial resistance is near the $18,300 zone or the 23.6% Fib retracement level of the recent decline from the $18,986 high to $18,033 low. There is also a short-term contracting triangle forming with resistance near $18,320 on the hourly chart of the BTC/USD pair.
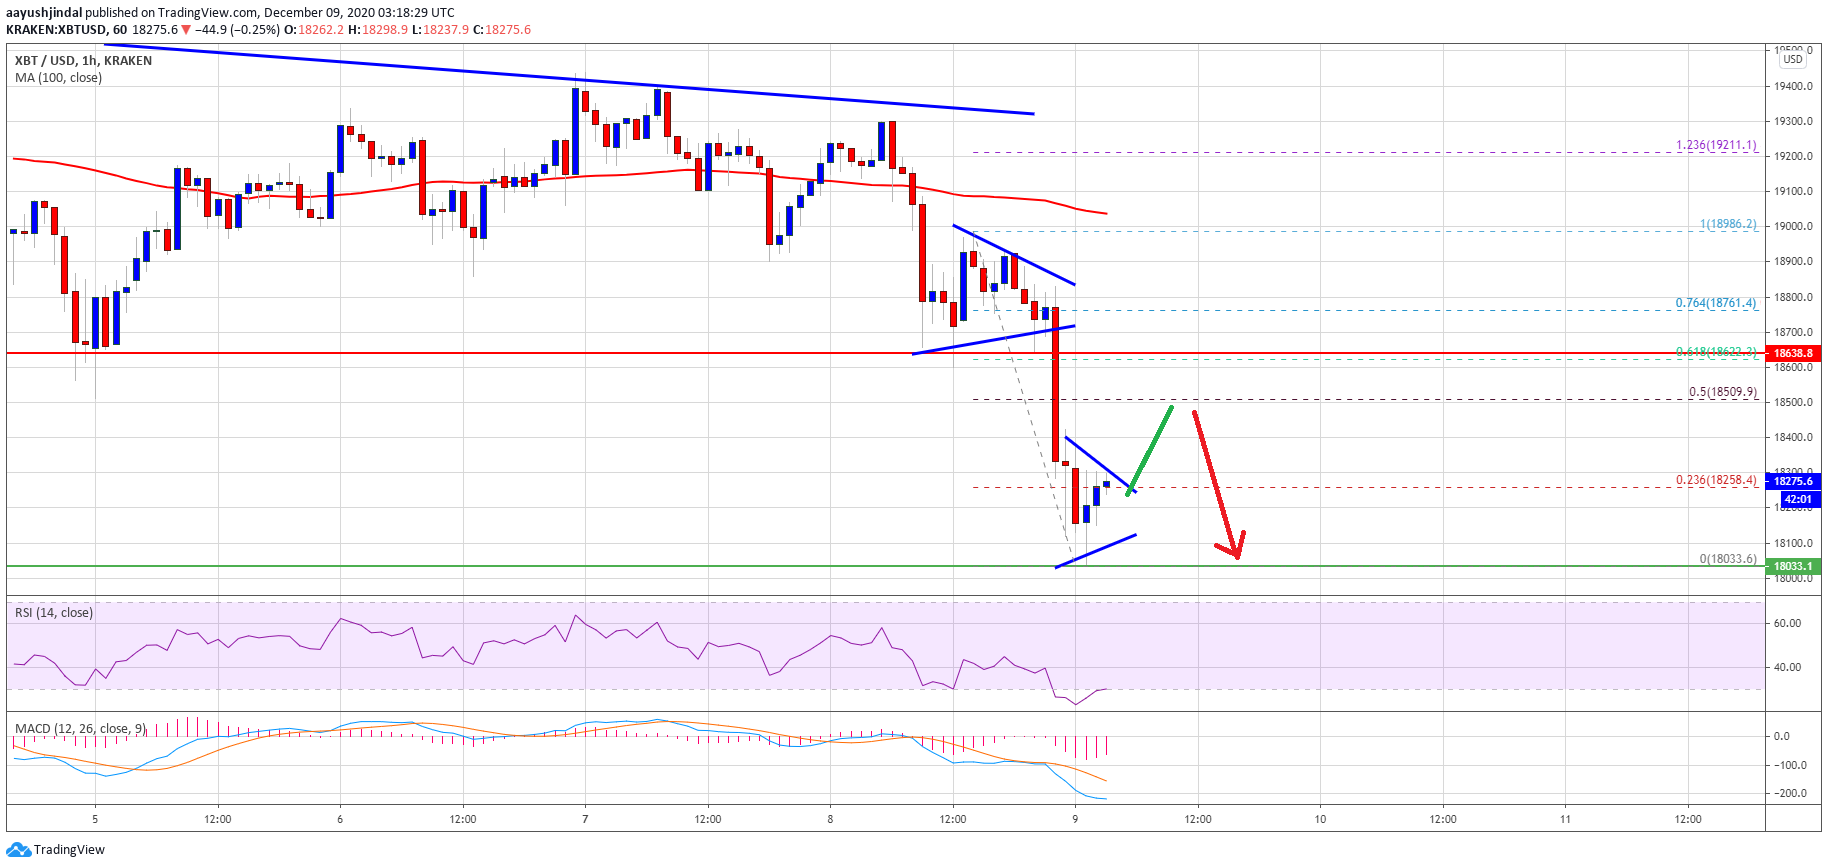
Source: BTCUSD on TradingView.com
If there is an upside break above the triangle resistance, bitcoin price might recover above $18,350. The next major resistance is near the $18,500 level. It is close to the 50% Fib retracement level of the recent decline from the $18,986 high to $18,033 low.
The main resistance is near the $18,600 level (the recent breakdown zone). A close above the $18,600 level is must for a recovery wave towards the $19,000 level.
More Losses in BTC?
If bitcoin fails to clear the $18,500 resistance zone, it could continue to move down. An initial support is near the triangle lower trend line at $18,100.
The first major support is near $18,000, below which the price might decline sharply. The next major support is near the $17,650 level. Any more losses might lead the price towards the $17,200 level.
Technical indicators:
Hourly MACD – The MACD is showing many negative signs in the bearish zone.
Hourly RSI (Relative Strength Index) – The RSI for BTC/USD is currently recovering from the 22 level.
Major Support Levels – $18,100, followed by $18,000.
Major Resistance Levels – $18,320, $18,500 and $18,600.