Reason to trust
How Our News is Made
Strict editorial policy that focuses on accuracy, relevance, and impartiality
Ad discliamer
Morbi pretium leo et nisl aliquam mollis. Quisque arcu lorem, ultricies quis pellentesque nec, ullamcorper eu odio.
Bitcoin price extended its decline below $31,500 before recovering higher against the US Dollar. BTC is likely to face resistance near $32,200 and it might continue to move down.
- Bitcoin remains in a bearish zone and it recently traded towards the $31,000 level.
- The price is now trading well below $33,000 and the 100 hourly simple moving average.
- There is a major bearish trend line forming with resistance near $32,250 on the hourly chart of the BTC/USD pair (data feed from Kraken).
- The pair must settle above $32,250 and the 100 hourly SMA to start a decent increase in the near term.
Bitcoin Price Remains In Downtrend
After a minor upside correction, bitcoin price failed near $33,000. As a result, BTC started a fresh decline below the $32,000 support level. It even broke the $31,550 swing low and settled well below the 100 hourly simple moving average.
It traded as low as $31,190 before it started an upside correction. There was a break above the $31,500 and $31,600 resistance levels. Bitcoin climbed above the 23.6% Fib retracement level of the recent decline from the $33,210 swing high to $31,190 low.
An immediate resistance on the upside is near the $32,000 level. The first major resistance is near the $32,200 level. There is also a major bearish trend line forming with resistance near $32,250 on the hourly chart of the BTC/USD pair.
The trend line is close to the 50% Fib retracement level of the recent decline from the $33,210 swing high to $31,190 low. A close above the trend line resistance could push the price towards the $33,000 resistance and the 100 hourly SMA.
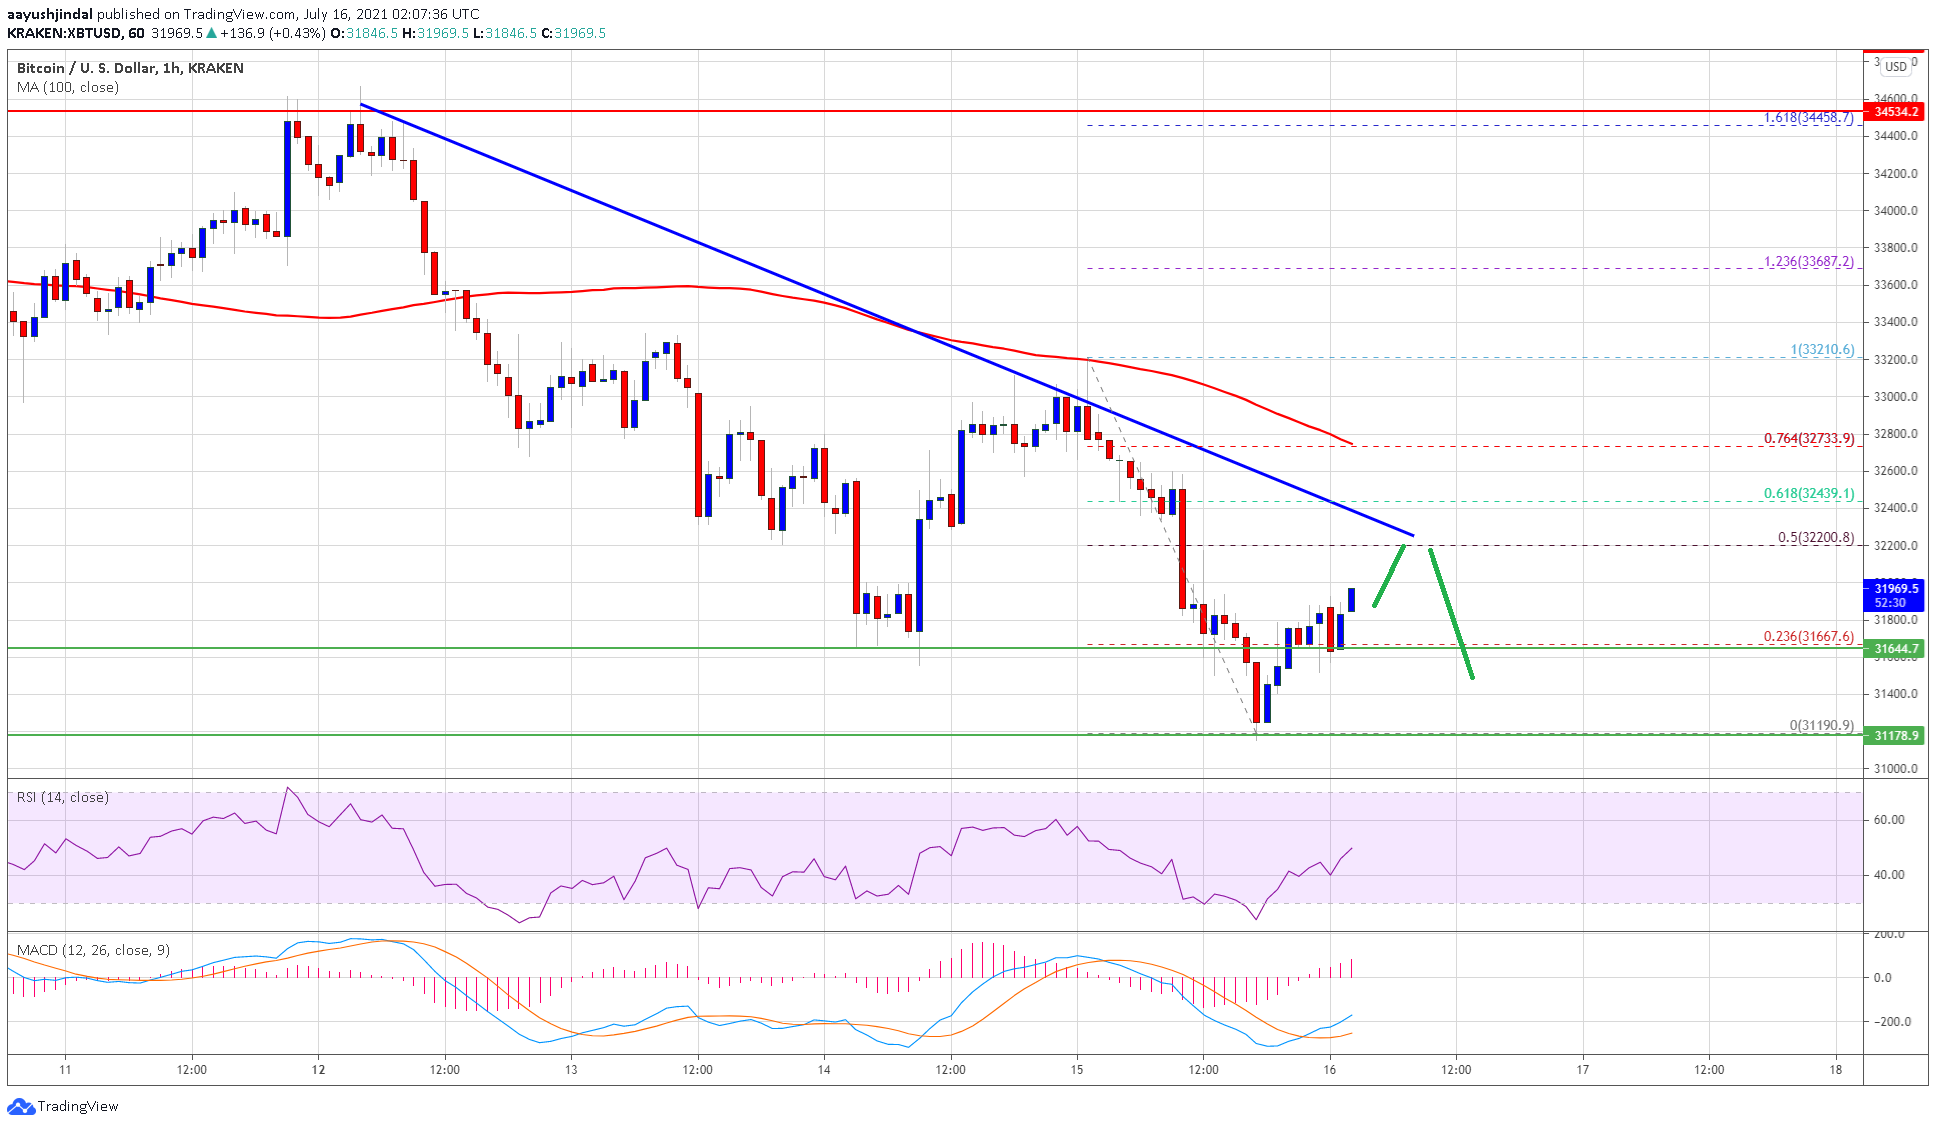
Source: BTCUSD on TradingView.com
To start a decent increase, the price must settle above the $33,000 level and the 100 hourly SMA. The next major resistance sits near $33,500.
More Losses in BTC?
If bitcoin fails to recover above the $32,200 and $33,000 resistance levels, there is a risk of more losses. An initial support on the downside is near the $31,500 level.
The first major support is now near the $31,200 zone. A close below the $31,200 level could spark a steady decline in the near term. In the stated case, the price is likely to test the $30,000 support level.
Technical indicators:
Hourly MACD – The MACD is slowly gaining pace in the bullish zone.
Hourly RSI (Relative Strength Index) – The RSI for BTC/USD is now just above the 50 level.
Major Support Levels – $31,500, followed by $31,200.
Major Resistance Levels – $32,200, $32,500 and $33,000.