Reason to trust
How Our News is Made
Strict editorial policy that focuses on accuracy, relevance, and impartiality
Ad discliamer
Morbi pretium leo et nisl aliquam mollis. Quisque arcu lorem, ultricies quis pellentesque nec, ullamcorper eu odio.
Bitcoin price is slowly moving lower and it is trading well below $33,500 against the US Dollar. BTC remains at a risk of a larger decline if it breaks the $32,000 support zone.
- Bitcoin is struggling to recover and it is trading well below $33,500 and $33,000.
- The price is now trading near $32,200, but it is well below the 100 hourly simple moving average.
- There was a break below a bearish continuation pattern with support near $32,900 on the hourly chart of the BTC/USD pair (data feed from Kraken).
- The pair is likely to accelerate lower if there is a clear break below the $32,200 support zone.
Bitcoin Price Remains At Risk
In the past few sessions, bitcoin price saw bearish moves below the $34,000 and $33,500 support levels. BTC even traded below the $33,000 level and it settled well below the 100 hourly simple moving average.
There was also a break below a bearish continuation pattern with support near $32,900 on the hourly chart of the BTC/USD pair. It is now trading near $32,200, but it is well below the 100 hourly simple moving average. The recent low was formed near $32,208 and the price is now consolidating.
An immediate resistance is near the $32,500 level. It is near the 23.6% Fib retracement level of the recent decline from the $33,354 high to $32,208 low.
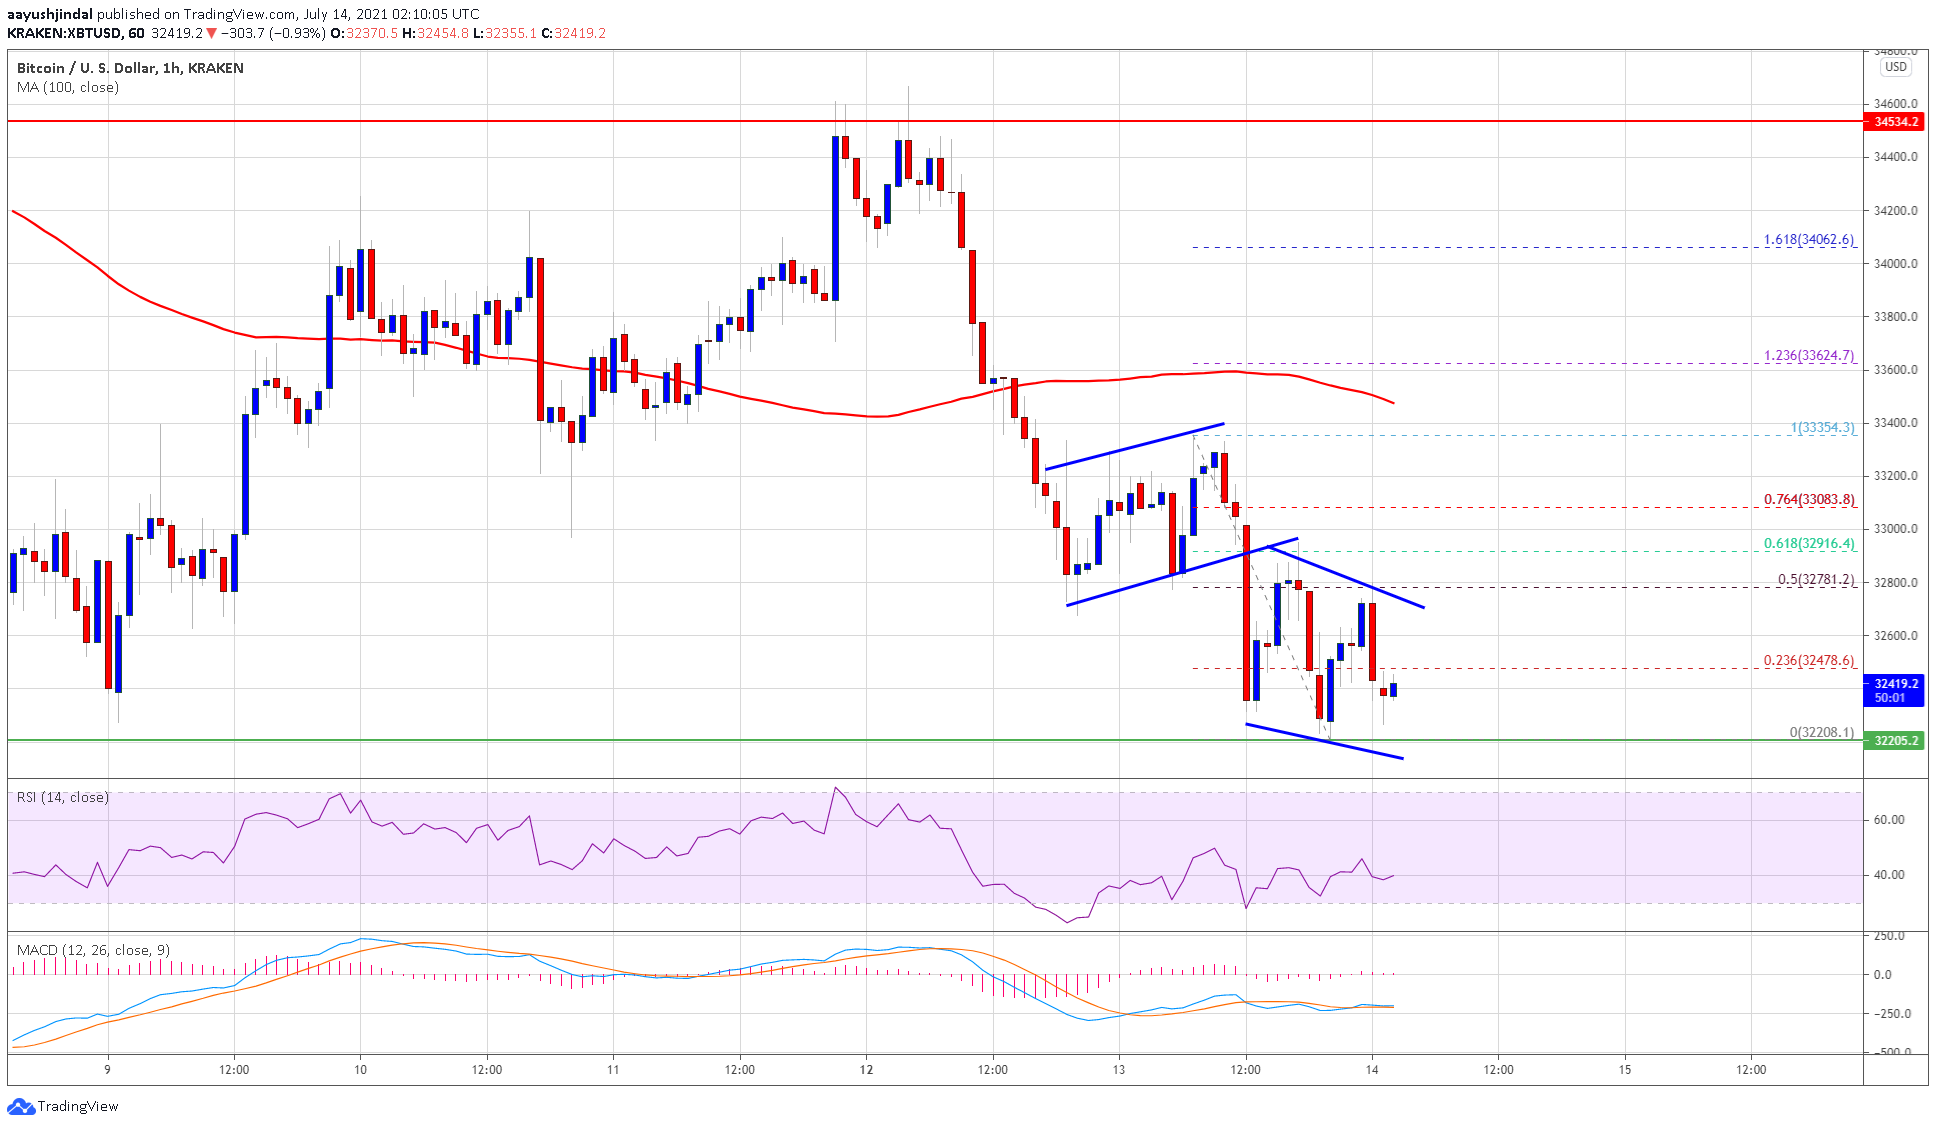
Source: BTCUSD on TradingView.com
There is also a declining channel forming with resistance near $32,800 on the same chart. The channel resistance is close to the 50% Fib retracement level of the recent decline from the $33,354 high to $32,208 low. A clear break above the channel resistance and then $33,000 could start a decent recovery. The next major resistance sits near $33,500.
More Losses in BTC?
If bitcoin fails to recover above the $33,000 and $33,500 resistance levels, there is a risk of a larger decline. An initial support on the downside is near the $32,200 level.
The main support is still near the $32,000 level, below which the price might easily dive towards the $30,000 level. Any more losses could set the pace for a drop towards the $28,800 level in the near term.
Technical indicators:
Hourly MACD – The MACD is slowly moving into the bullish zone.
Hourly RSI (Relative Strength Index) – The RSI for BTC/USD is now well below the 50 level.
Major Support Levels – $32,200, followed by $32,000.
Major Resistance Levels – $33,000, $33,500 and $34,000.