
Reason to trust
How Our News is Made
Strict editorial policy that focuses on accuracy, relevance, and impartiality
Ad discliamer
Morbi pretium leo et nisl aliquam mollis. Quisque arcu lorem, ultricies quis pellentesque nec, ullamcorper eu odio.
Bitcoin price started a strong increase above $45,000 against the US Dollar. BTC is now facing resistance near $50,000, but it might continue to rise.
- Bitcoin gained pace above the $45,500 and $47,500 resistance levels.
- The price is now trading above $47,000 and the 100 hourly simple moving average.
- There is a key bullish trend line forming with support near $47,000 on the hourly chart of the BTC/USD pair (data feed from Kraken).
- The pair could correct lower, but the bulls might remain active near $47,000 or $46,500.
Bitcoin Price Gains Pace
Bitcoin price started a strong increase above the $45,000 resistance level. BTC broke the $46,500 resistance level and settled above the 100 hourly simple moving average.
The bulls gained strength and the price pumped above the $47,500 resistance. It even broke the $48,800 level and traded as high as $49,257. It is now correcting lower and trading below $48,500. An immediate support on the downside is near the $47,500 level.
Bitcoin is now trading well above the 23.6% Fib retracement level of the recent rally from the $40,890 swing low to $49,257 high. There is also a key bullish trend line forming with support near $47,000 on the hourly chart of the BTC/USD pair.
On the upside, an immediate resistance is near the $48,000 level. The first major resistance is near the $48,500 level, above which the price could revisit $49,250.
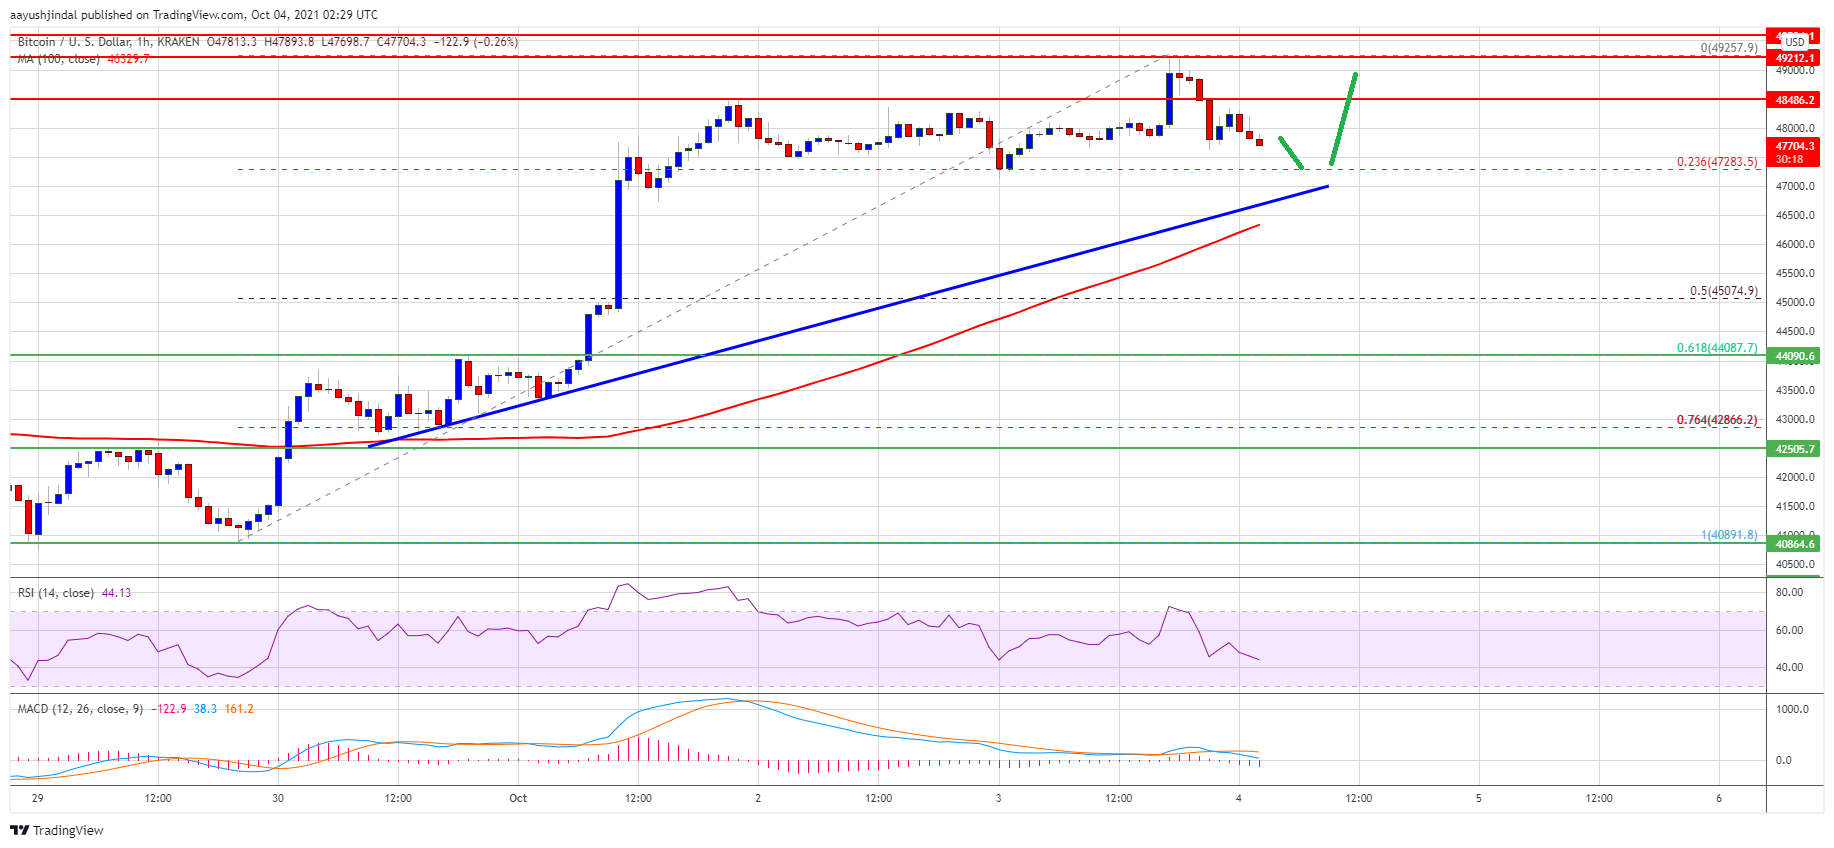
Source: BTCUSD on TradingView.com
The next major resistance is near the $50,000 level. A close above the $50,000 level could start a major increase in the near term. In the stated case, the price might rise towards the $52,000 level in the near term.
Dips Supported In BTC?
If bitcoin fails to clear the $48,500 resistance zone, it could start a fresh downside correction. An immediate support on the downside is near the $47,500 level. The first major support is now forming near the $47,250 level and the channel trend line.
A break below the trend line support might push the price towards the $46,500 level. The 100 hourly simple moving average is also near the $46,500 level to provide support. The next major support might be near the 50% Fib retracement level of the recent rally from the $40,890 swing low to $49,257 high at $45,075.
Technical indicators:
Hourly MACD – The MACD is now losing pace in the bullish zone.
Hourly RSI (Relative Strength Index) – The RSI for BTC/USD is now just below the 50 level.
Major Support Levels – $47,250, followed by $46,500.
Major Resistance Levels – $48,500, $49,250 and $50,000.


