
Reason to trust
How Our News is Made
Strict editorial policy that focuses on accuracy, relevance, and impartiality
Ad discliamer
Morbi pretium leo et nisl aliquam mollis. Quisque arcu lorem, ultricies quis pellentesque nec, ullamcorper eu odio.
Bitcoin price is facing a strong resistance near $15,500 and $15,600 against the US Dollar. BTC could clear the $15,500 resistance unless there is a clear break below the 100 hourly SMA.
- Bitcoin is facing a strong barrier near the $15,500 and $15,600 resistance levels.
- The price is currently holding the $15,200 support and the 100 hourly simple moving average.
- There is a major bullish trend line forming with support near $15,200 on the hourly chart of the BTC/USD pair (data feed from Kraken).
- The pair could either rally above the $15,500 resistance or it might decline heavily below the 100 hourly SMA.
Bitcoin Price is Stuck Below $15,500
After forming a decent support near $15,000, bitcoin price attempted another increase. BTC broke the $15,200 pivot level to avoid more losses and it settled above the 100 hourly simple moving average.
There was a break above the 50% Fib retracement level of the downward move from the $15,850 high to $14,815 swing low. The price even climbed above the $15,400 level, but it seems like the bulls are facing an uphill task near the $15,500 level.
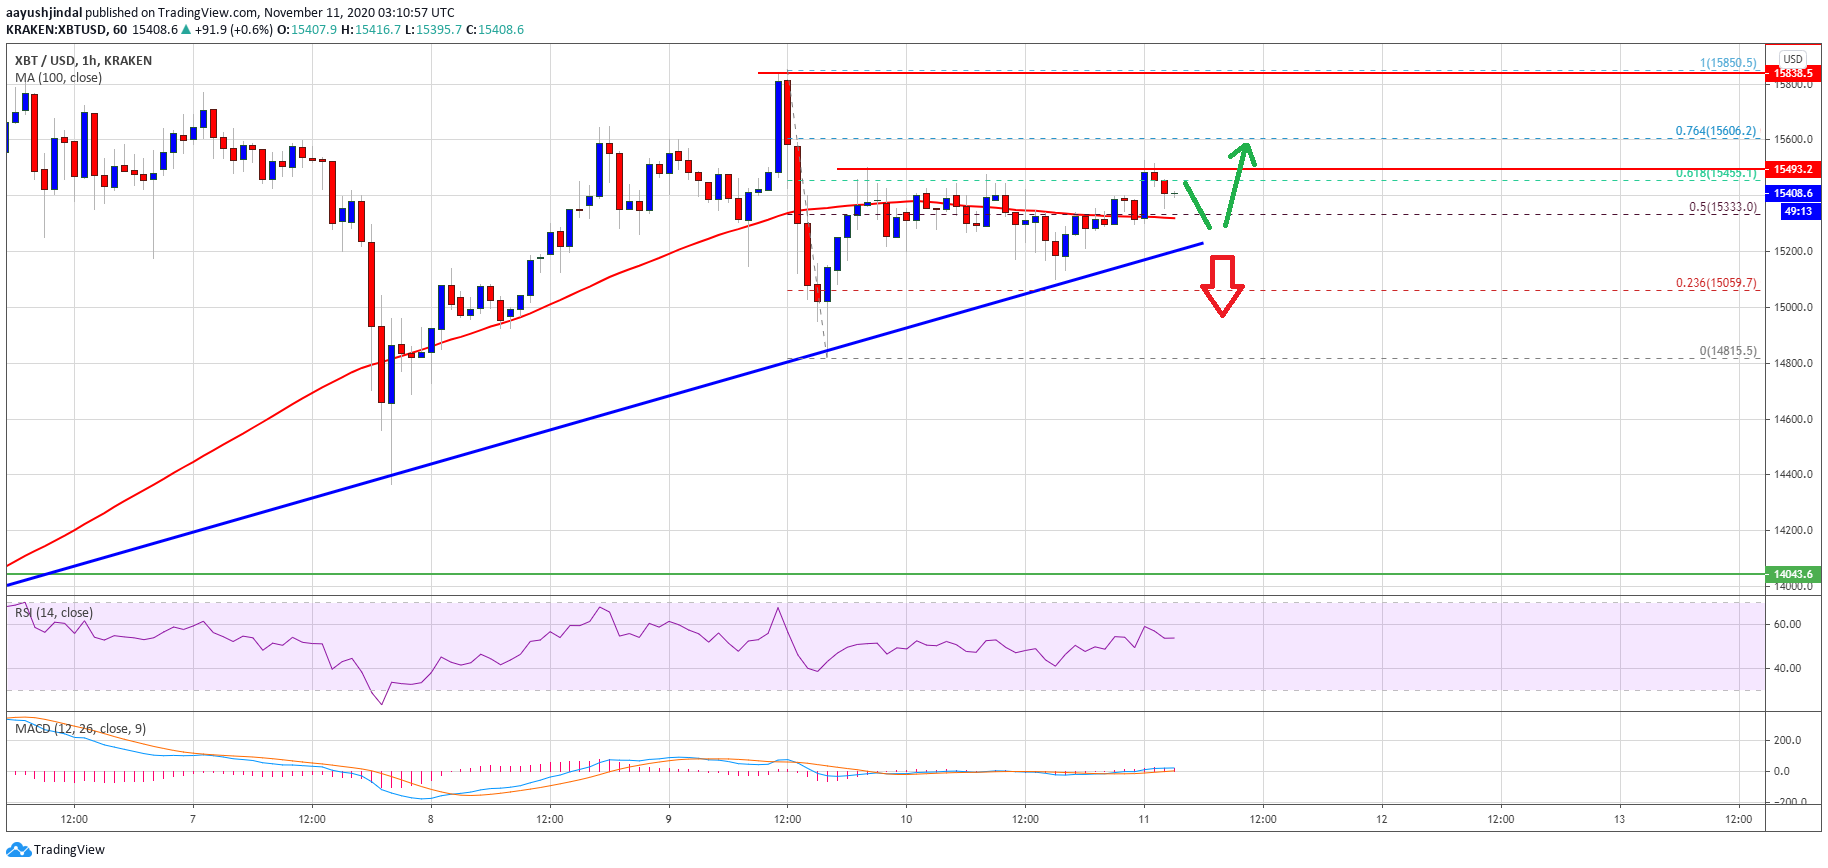
Source: BTCUSD on TradingView.com
The 61.8% Fib retracement level of the downward move from the $15,850 high to $14,815 swing low is also acting as a resistance. On the downside, there is a major bullish trend line forming with support near $15,200 on the hourly chart of the BTC/USD pair.
It seems like bitcoin price is approaching a major breakout either above the $15,500 resistance or below the trend line support. If there is a clear break and close above $15,500, the price could rise sharply. The next immediate resistance is near $15,600, above which the price could revisit the $15,850 high.
Role of 100 Hourly SMA for BTC?
If bitcoin fails to clear the $15,500 resistance, there is a risk of a downside break. An initial support is near the $15,200 level, the trend line, and the 100 hourly SMA.
A proper close below the trend line support and the 100 hourly SMA could trigger a sharp decline. The next key support is near the $15,000 level, below which there is a risk of a drop below the $14,815 swing low in the near term.
Technical indicators:
Hourly MACD – The MACD is struggling to move into the bullish zone.
Hourly RSI (Relative Strength Index) – The RSI for BTC/USD is currently above the 50 level.
Major Support Levels – $15,200, followed by $15,000.
Major Resistance Levels – $15,450, $15,500 and $15,600.


