Reason to trust
How Our News is Made
Strict editorial policy that focuses on accuracy, relevance, and impartiality
Ad discliamer
Morbi pretium leo et nisl aliquam mollis. Quisque arcu lorem, ultricies quis pellentesque nec, ullamcorper eu odio.
Bitcoin price is up over 12% and it broke many hurdles near $20,000 and $22,000 against the US Dollar. BTC is showing strong bullish signs and it could continue to rise in the near term.
- Bitcoin started a strong surge after it cleared the $19,800 and $20,000 resistance levels.
- The price is currently well above the $21,500 level and the 100 hourly simple moving average.
- There was a break above a couple of bullish continuation patters near $19,754 and $20,900 on the hourly chart of the BTC/USD pair (data feed from Kraken).
- The pair could correct lower, but downsides might find support near $21,600 or $21,250.
Bitcoin Price is Surging
Yesterday, there was a clear break in bitcoin price above the $19,500 and $19,800 resistance levels. As a result, BTC broke the $20,000 barrier to start a strong upward move.
The price traded to a new all-time high and settled above the 100 hourly simple moving average. The bulls are clearly in action, as they managed to pump the price above $21,000 and $22,000. During the rise, there was a break above a couple of bullish continuation patters near $19,754 and $20,900 on the hourly chart of the BTC/USD pair.
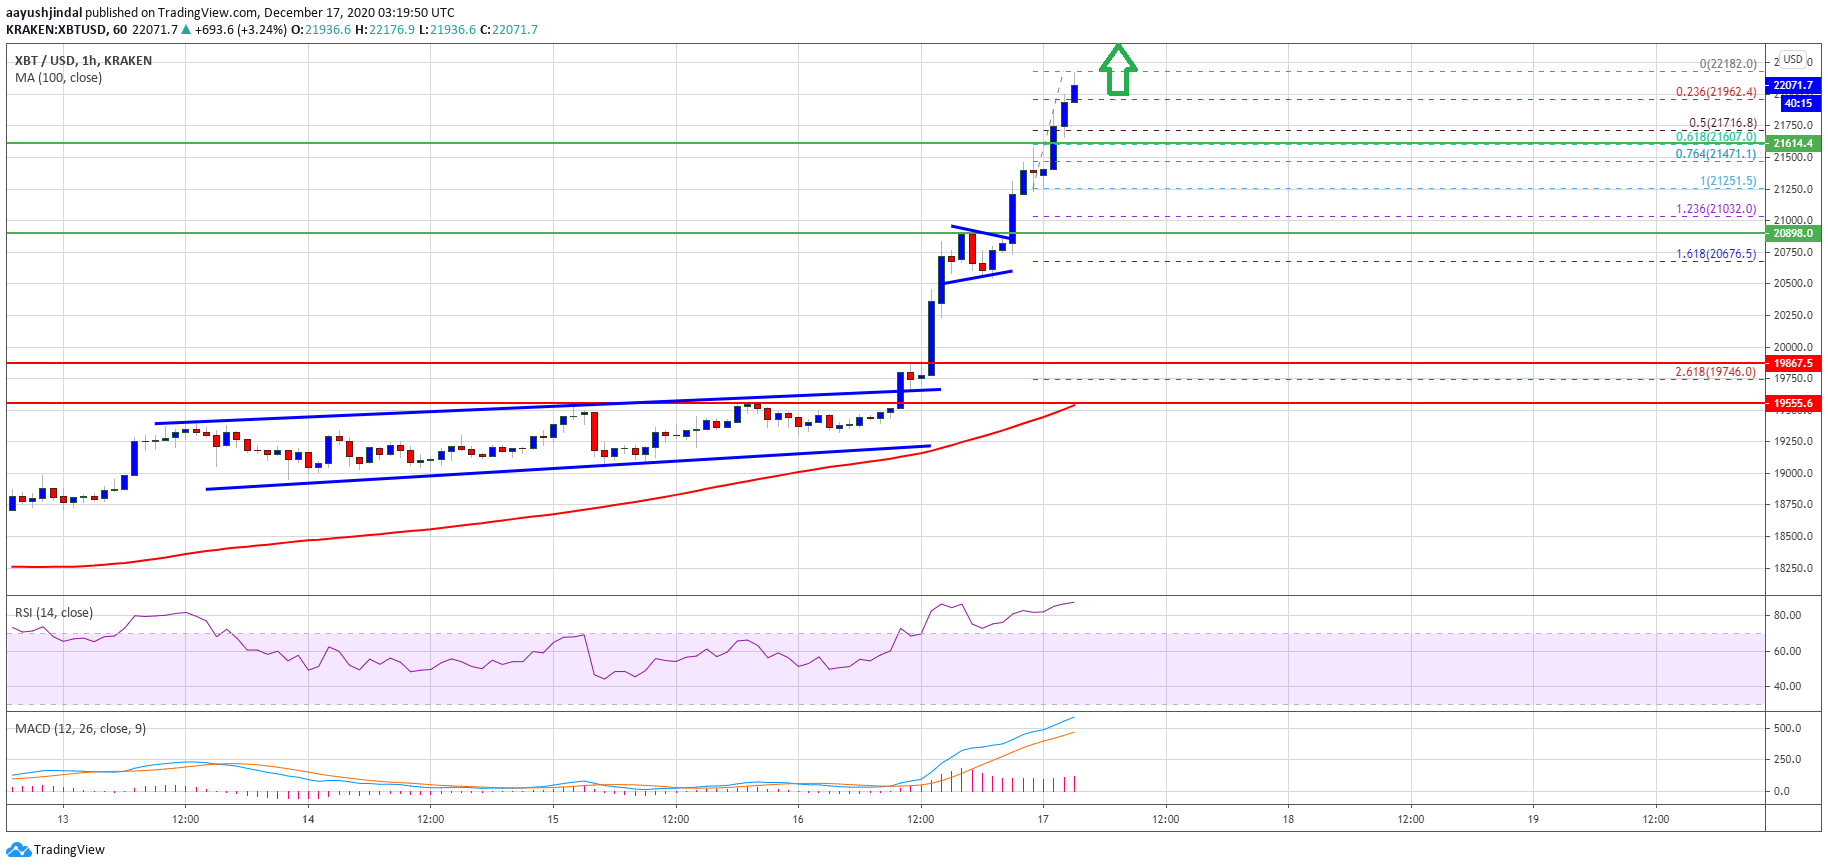
Source: BTCUSD on TradingView.com
The pair gained pace and it traded as high as $22,182 recently. It is currently consolidating gains and trading near $22,000. On the downside, an initial support is near the $21,700 level. It is close to the 50% Fib retracement level of the recent surge from the $21,251 swing low to $22,182 high.
On the upside, bitcoin price might face resistance near $22,200 and $22,450 levels. Any more upsides could lead the price towards the $23,500 level in the near term.
Downsides Supported in BTC?
If bitcoin starts a short-term downside correction, it could find support near the $21,700 level. The first key support is near the $21,600 level.
The 61.8% Fib retracement level of the recent surge from the $21,251 swing low to $22,182 high is near $21,600 to provide support. Any more losses may possibly call for a test of the $21,000 zone in the near term.
Technical indicators:
Hourly MACD – The MACD is showing many positive signs in the bullish zone.
Hourly RSI (Relative Strength Index) – The RSI for BTC/USD is currently well in the overbought zone.
Major Support Levels – $21,700, followed by $21,600.
Major Resistance Levels – $22,200, $22,450 and $23,500.


