
Reason to trust
How Our News is Made
Strict editorial policy that focuses on accuracy, relevance, and impartiality
Ad discliamer
Morbi pretium leo et nisl aliquam mollis. Quisque arcu lorem, ultricies quis pellentesque nec, ullamcorper eu odio.
Bitcoin price is trading in a range below the $57,500 resistance against the US Dollar. BTC is likely to start a major decline if there is a clear break below the $53,500 support zone.
- Bitcoin is struggling to gain momentum above the $56,000 and $56,500 levels.
- The price is now trading well below $56,500 and the 100 hourly simple moving average.
- There is a new declining channel forming with resistance near $55,750 on the hourly chart of the BTC/USD pair (data feed from Kraken).
- The pair could correct higher, but the bulls are likely to struggle near $55,750 and $56,500.
Bitcoin Price Remains At Risk
Bitcoin recovered higher above the $56,000 level, but the bulls failed to gain strength. BTC topped near the $56,400 level and it failed to clear the 100 hourly simple moving average.
A high was formed near $56,404 and the price resumed its decline. It broke the $55,400 support and revisited the $53,500 support zone. A low is formed near $53,650 and the price is now consolidating losses. An immediate resistance is near the $55,050 level.
The 50% Fib retracement level of the recent decline from the $56,404 high to $53,670 low is also near $55,050. The next key resistance is near the $55,400 level.
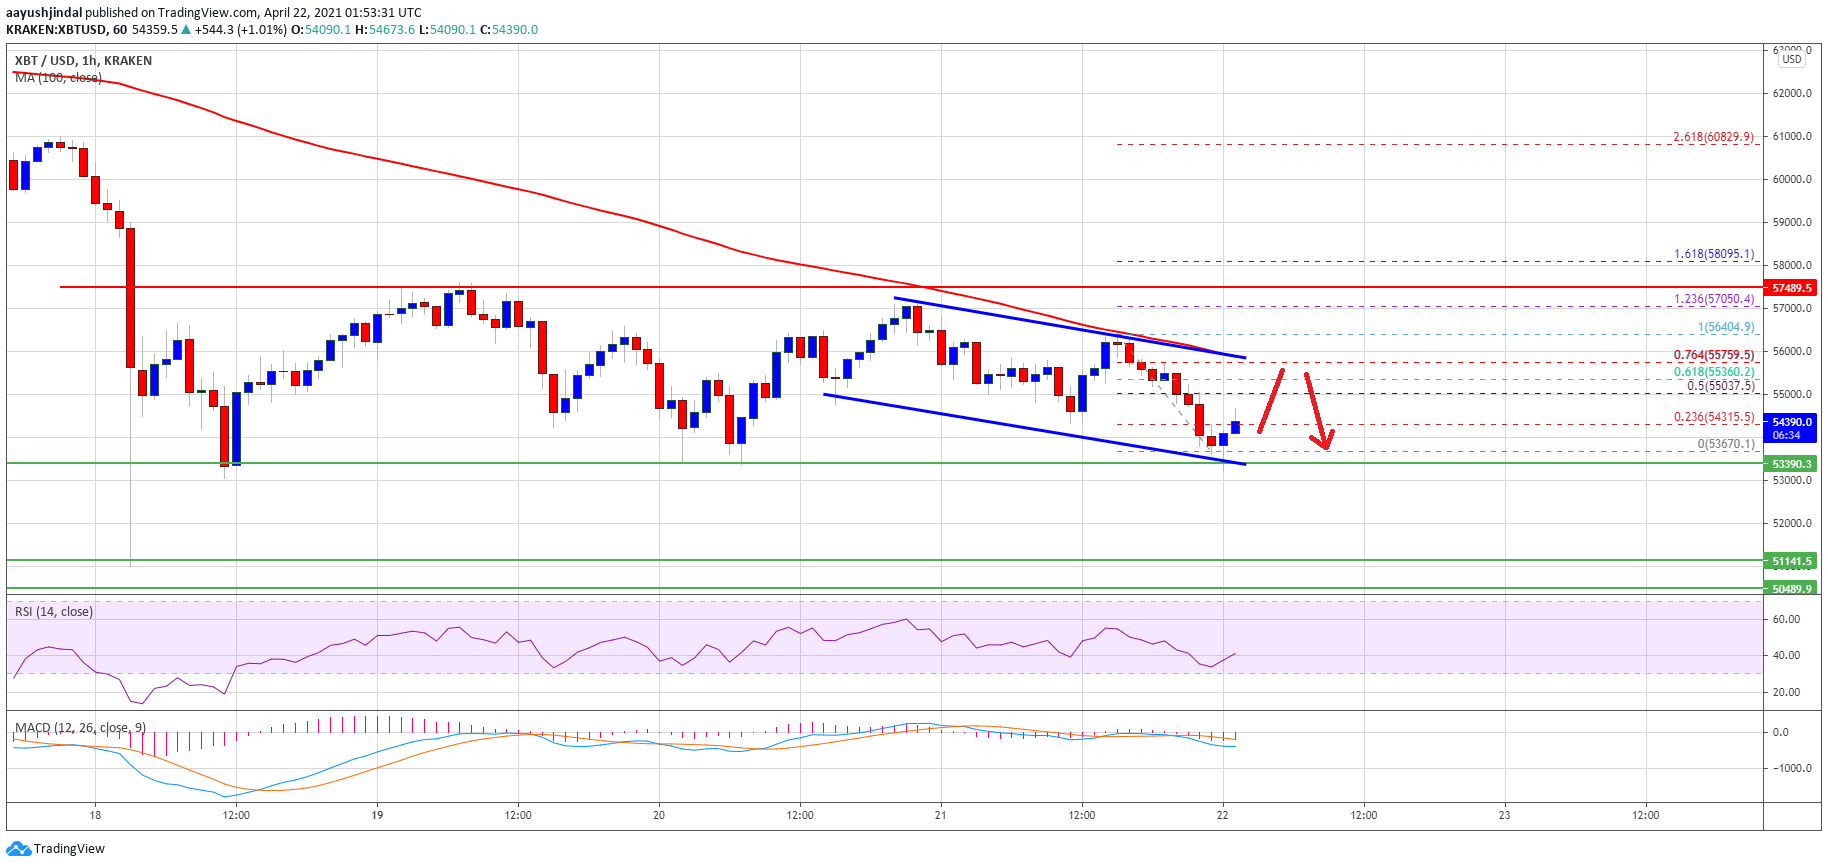
Source: BTCUSD on TradingView.com
Moreover, there is a new declining channel forming with resistance near $55,750 on the hourly chart of the BTC/USD pair. The channel resistance is close to the 76.4% Fib retracement level of the recent decline from the $56,404 high to $53,670 low.
Above the channel resistance, the main range resistance is near the $57,500 level. A successful break above the channel resistance and then a follow up move above $57,500 is must to start a fresh rally.
Downside Break in BTC?
If bitcoin fails to clear the $55,050 and $55,500 resistance levels, it could correct lower. An immediate support on the downside is near the $54,000 level.
The first key support is near the $53,500 level and the channel lower trend line. Any more losses may possibly call for a downside break towards the $51,000 and $50,000 levels.
Technical indicators:
Hourly MACD – The MACD is slowly gaining pace in the bearish zone.
Hourly RSI (Relative Strength Index) – The RSI for BTC/USD is now below the 50 level.
Major Support Levels – $54,000, followed by $53,500.
Major Resistance Levels – $55,050, $55,500 and $56,500.