
Reason to trust
How Our News is Made
Strict editorial policy that focuses on accuracy, relevance, and impartiality
Ad discliamer
Morbi pretium leo et nisl aliquam mollis. Quisque arcu lorem, ultricies quis pellentesque nec, ullamcorper eu odio.
Bitcoin price failed again to clear the $18,800 resistance against the US Dollar. BTC is trading in a range and it could correct lower sharply if there is a break below $18,200.
- Bitcoin is still trading well below the key resistance area near the $18,700 and $18,800 levels.
- The price is now below $18,500 and the 100 hourly simple moving average.
- There is a key contracting triangle forming with resistance near $18,480 on the hourly chart of the BTC/USD pair (data feed from Kraken).
- The pair could decline sharply if there is a clear break below $18,200 and $18,050.
Bitcoin Price is Showing a Few Bearish Signs
There was another attempt by bitcoin price to clear the $18,700 and $18,800 resistance levels. However, BTC bulls failed to gain strength, resulting in a fresh decline below the $18,600 level.
The price even broke the $18,500 level and settled below the 100 hourly simple moving average. Conversely, there were strong bullish moves in Ethereum and ripple, breaking the $600 and $0.60 resistance respectively.
Bitcoin price traded as low as $18,160 and it is currently consolidating in a range. There was a break above the $18,250 level. It even traded above the 23.6% Fib retracement level of the recent drop from the $18,782 high to $18,160 low.
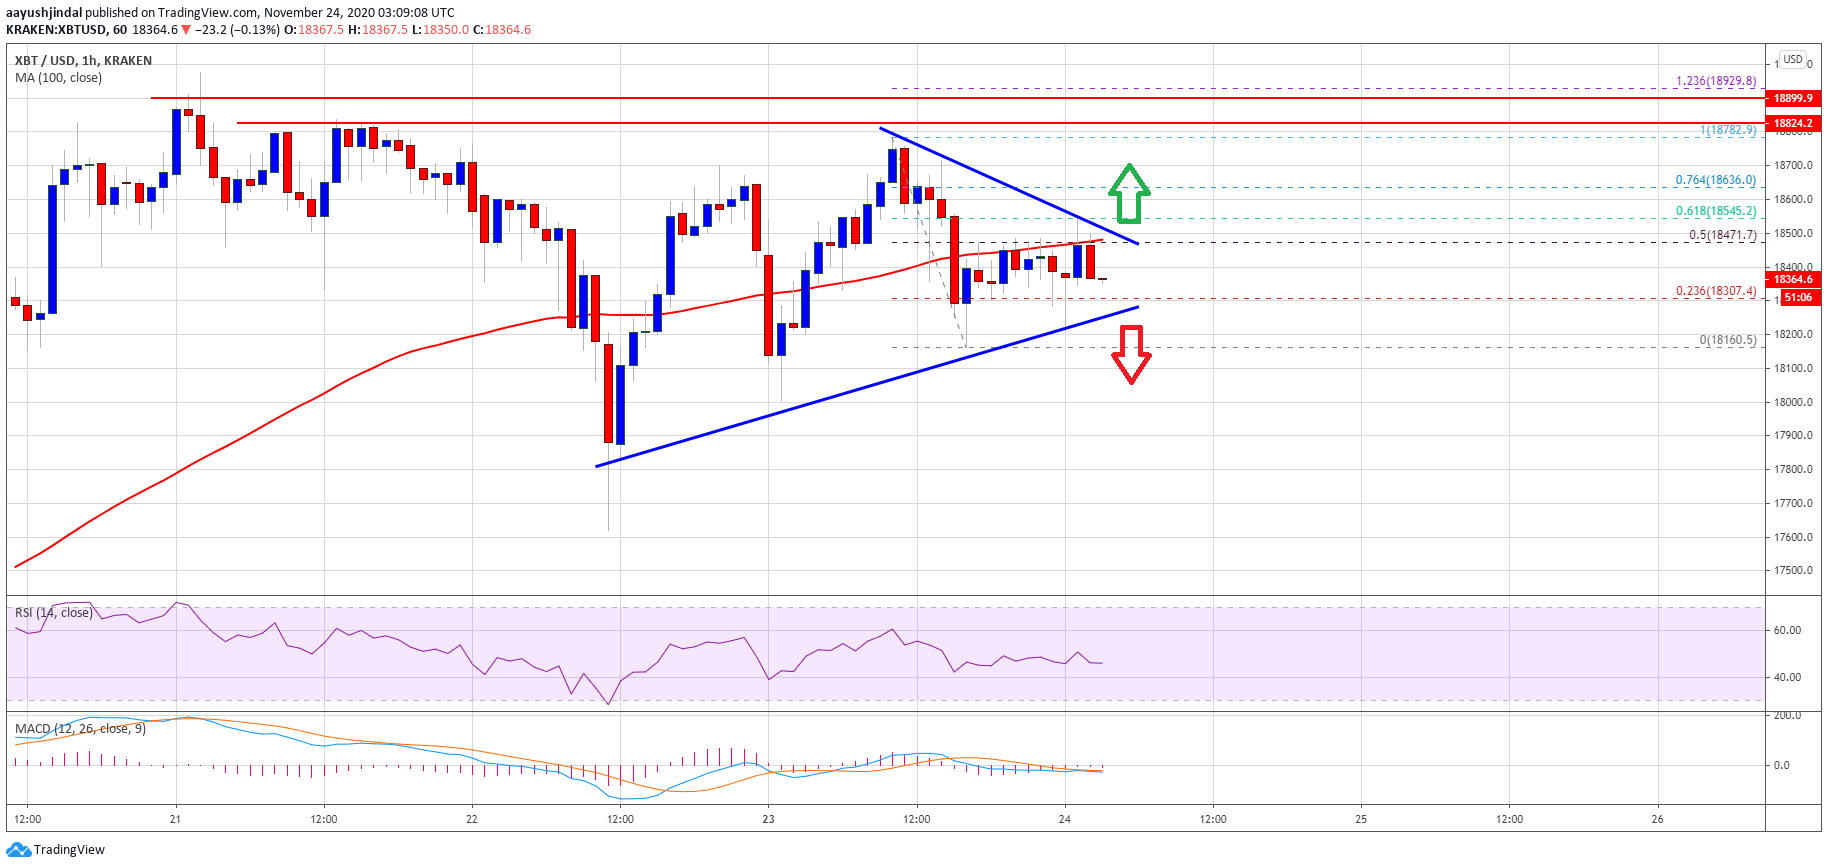
Source: BTCUSD on TradingView.com
The price is now facing a strong resistance near the $18,450 level and the 100 hourly simple moving average. There is also a key contracting triangle forming with resistance near $18,480 on the hourly chart of the BTC/USD pair.
The triangle resistance is close to the 50% Fib retracement level of the recent drop from the $18,782 high to $18,160 low. If there is an upside break above $18,500, the price could make another attempt to clear the $18,700 and $18,800 resistance levels.
Downside Break in BTC?
If bitcoin fails to clear the $18,500 resistance, there is a risk of a downside break. An initial support is near the triangle lower trend line at $18,280.
A clear break below the triangle support might lead the price towards the $18,160 swing low. In the stated case, there is even a risk of more losses below the $18,000 support level in the coming sessions.
Technical indicators:
Hourly MACD – The MACD is slowly losing momentum in the bearish zone.
Hourly RSI (Relative Strength Index) – The RSI for BTC/USD is currently just below the 50 level.
Major Support Levels – $18,280, followed by $18,160.
Major Resistance Levels – $18,500, $18,700 and $18,800.


