
Reason to trust
How Our News is Made
Strict editorial policy that focuses on accuracy, relevance, and impartiality
Ad discliamer
Morbi pretium leo et nisl aliquam mollis. Quisque arcu lorem, ultricies quis pellentesque nec, ullamcorper eu odio.
Bitcoin price failed to continue higher above $60,800 and corrected lower against the US Dollar. BTC is now holding gains and it is likely to rally above $61,000 unless there is a break below the 100 hourly SMA.
- Bitcoin is struggling to gain momentum above the $60,000 and $60,500 levels.
- The price is now trading above the $59,000 level and the 100 hourly simple moving average.
- There is a major contracting triangle forming with resistance near $60,050 on the hourly chart of the BTC/USD pair (data feed from Kraken).
- The pair is likely to start a major rally once it clears the $60,050 and $60,500 levels.
Bitcoin Price is Holding Gains
Bitcoin dipped sharply towards the $58,000 support after it was rejected above $60,500. However, BTC remained well bid above the $58,000 zone and it recovered losses.
There was a break above the $59,000 level and the price even climbed above $60,000. A high is formed near $60,677 and the price is currently consolidating. It traded below the 23.6% Fib retracement level of the upward move from the $58,025 low to $60,677 high.
On the downside, the price is finding bids near the $59,250 and $59,100 levels. The 50% Fib retracement level of the upward move from the $58,025 low to $60,677 high is also near the $59,350 level.
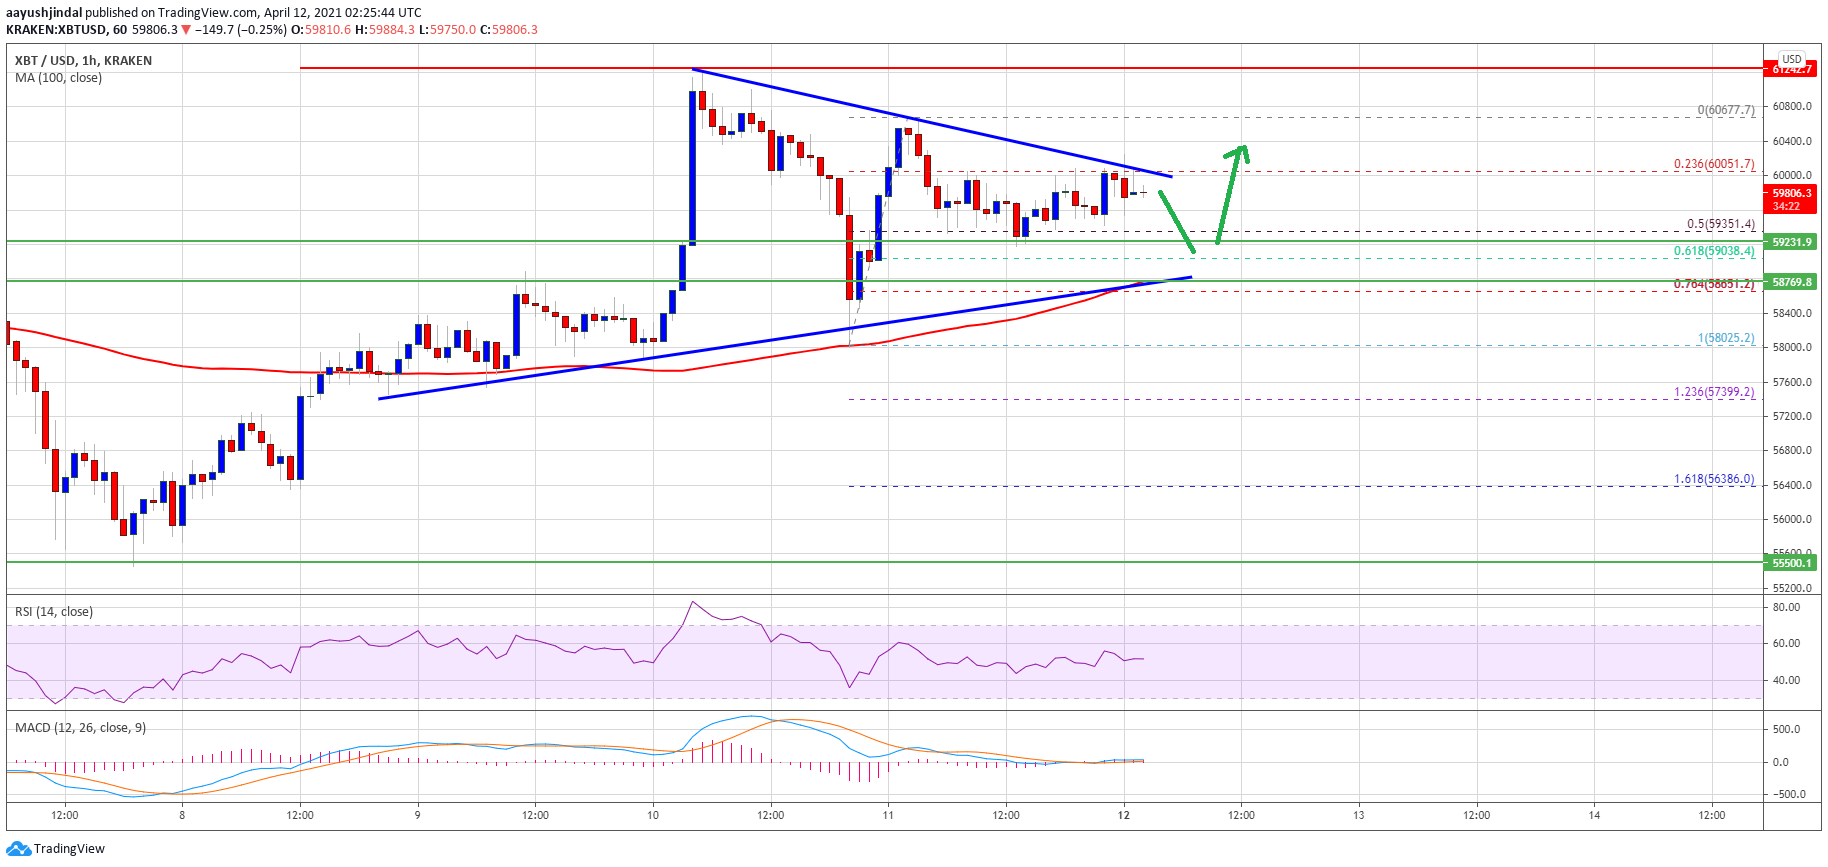
Source: BTCUSD on TradingView.com
There is also a major contracting triangle forming with resistance near $60,050 on the hourly chart of the BTC/USD pair. If there is an upside break above the $60,050 and $60,200 levels, there are high chances of a fresh rally. In the stated case, the price is likely to surge towards the $61,200 and $62,000 levels in the near term.
Dips Supported in BTC?
If bitcoin fails to climb above $60,050 and $60,200, there could be a short-term downside correction. An initial support on the downside is near the $58,350 level.
The next major support is near the triangle at $58,750 and the 100 hourly simple moving average. If the bulls fail to protect the 100 hourly SMA, there could be a sharp downside break. In the stated case, the price might decline towards the $56,800 level in the near term.
Technical indicators:
Hourly MACD – The MACD is now losing momentum in the bullish zone.
Hourly RSI (Relative Strength Index) – The RSI for BTC/USD is now just above the 50 level.
Major Support Levels – $59,350, followed by $59,000.
Major Resistance Levels – $60,050, $60,500 and $61,200.