
Reason to trust
How Our News is Made
Strict editorial policy that focuses on accuracy, relevance, and impartiality
Ad discliamer
Morbi pretium leo et nisl aliquam mollis. Quisque arcu lorem, ultricies quis pellentesque nec, ullamcorper eu odio.
Bitcoin price started a fresh increase from the $37,500 support against the US Dollar. BTC must clear the 100 hourly SMA and $40,000 to move into a positive zone.
- Bitcoin started a decent increase above the $38,000 and $38,500 resistance levels.
- The price is now struggling near the $40,000 zone and the 100 hourly simple moving average.
- There was a break above a major bearish trend line with resistance near $38,250 on the hourly chart of the BTC/USD pair (data feed from Kraken).
- The pair must settle above the $40,000 barrier to continue higher in the near term.
Bitcoin Price is Rising
Bitcoin price extended its decline below the $38,200 and $38,000 support levels. BTC tested the $37,500 zone, where the bulls took a stand.
A base was formed near $37,500 before the price started a fresh increase. Earlier, there was a break above a major bearish trend line with resistance near $38,250 on the hourly chart of the BTC/USD pair. The pair climbed higher nicely above the $38,000 and $38,500 resistance levels.
Bitcoin broke the 23.6% Fib retracement level of the main decline from the $42,630 swing high to $37,533 low. It is now struggling near the $40,000 zone and the 100 hourly simple moving average.
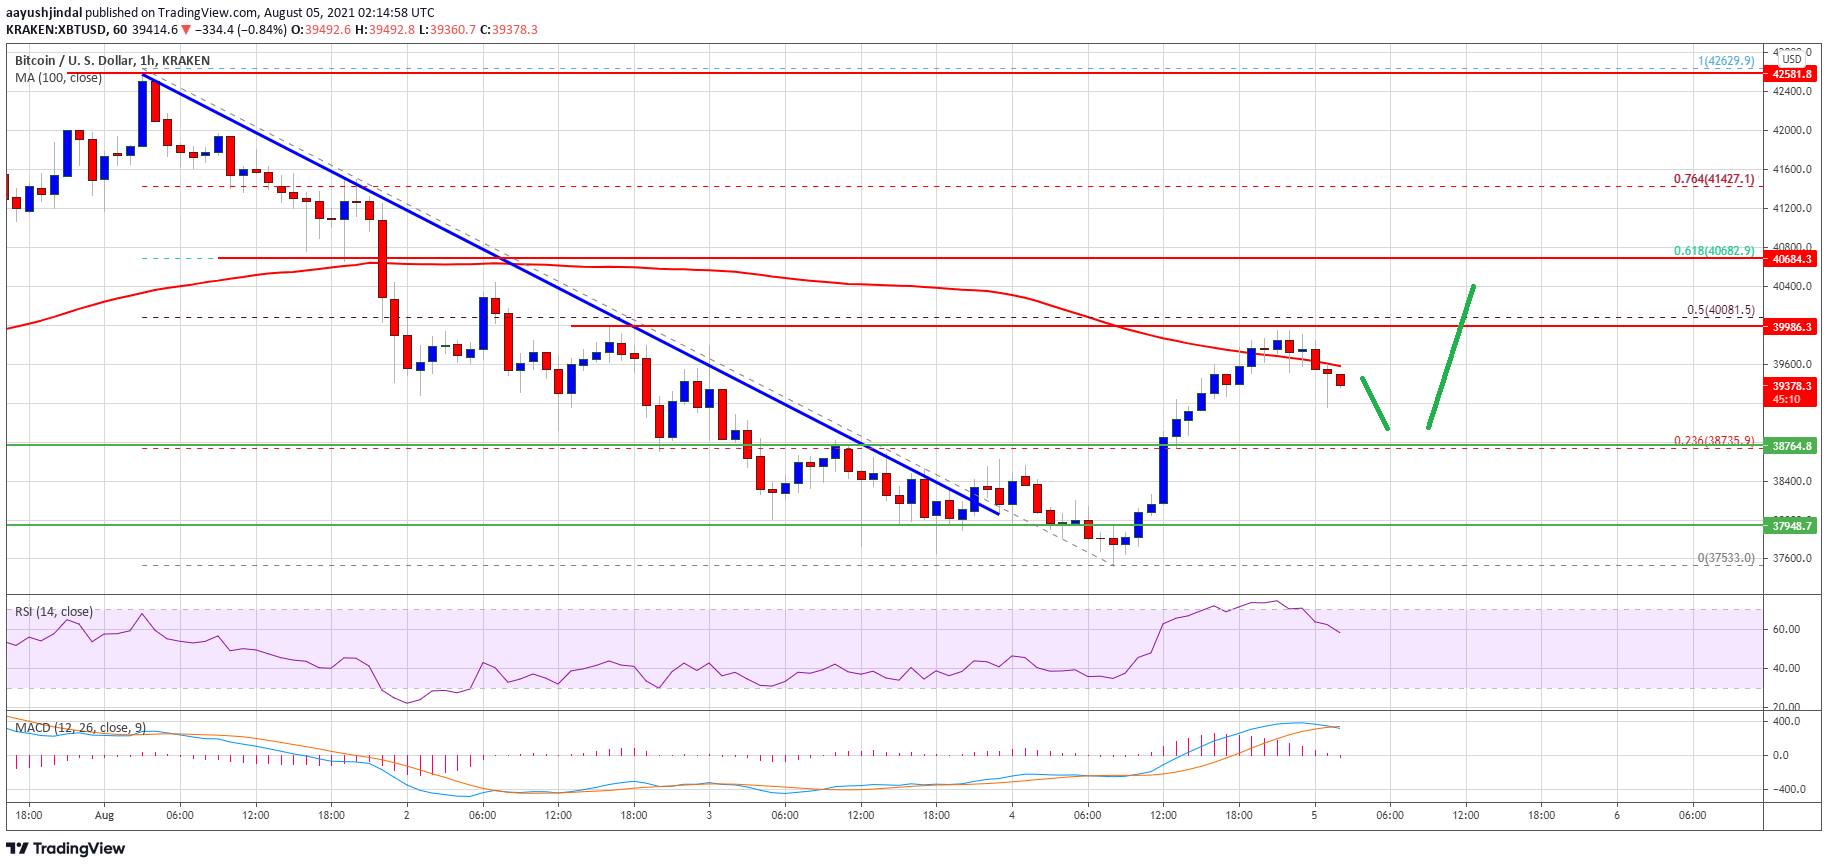
Source: BTCUSD on TradingView.com
The 50% Fib retracement level of the main decline from the $42,630 swing high to $37,533 low is also near the $40,000 zone. Therefore, a close above the 100 hourly SMA and $40,000 might trigger a steady increase. The next major resistance is near the $41,500 level. Any more gains could set the pace for a move towards the $42,500 resistance zone in the near term.
Fresh Decline in BTC?
If bitcoin fails to climb above the $40,000 and $40,200 resistance levels, it could start a fresh downside correction. An initial support on the downside is near the $39,000 level.
The first major support is now near the $38,750 zone. A clear downside break below the $38,750 support might call for a sharp decline. In the stated case, the price might decline towards the $38,000 level. The next major support is near the $37,500 zone.
Technical indicators:
Hourly MACD – The MACD is slowly losing pace in the bullish zone.
Hourly RSI (Relative Strength Index) – The RSI for BTC/USD is now well above the 50 level.
Major Support Levels – $38,750, followed by $38,000.
Major Resistance Levels – $40,000, $40,200 and $41,200.