
Reason to trust
How Our News is Made
Strict editorial policy that focuses on accuracy, relevance, and impartiality
Ad discliamer
Morbi pretium leo et nisl aliquam mollis. Quisque arcu lorem, ultricies quis pellentesque nec, ullamcorper eu odio.
Bitcoin failed to clear the $60,000 resistance zone against the US Dollar. BTC is moving lower, and it could extend losses towards $55,000 in the near term.
- Bitcoin struggled to recover above the $60,000 and $60,500 resistance levels.
- The price is now trading below $58,500 and the 100 hourly simple moving average.
- There was a break below a key bullish trend line with support near $59,200 on the hourly chart of the BTC/USD pair (data feed from Kraken).
- The pair is declining, and it seems like the bears are aiming more losses below $56,500.
Bitcoin Price Turns Red
Bitcoin price attempted a recovery wave above the $58,500 resistance zone. BTC spiked above the $60,000 zone, but there was no real bullish momentum.
As a result, the price started a fresh decline below the $59,200 level. The price traded below the $58,500 support zone and the 100 hourly simple moving average. Besides, there was a break below a key bullish trend line with support near $59,200 on the hourly chart of the BTC/USD pair.
Bitcoin traded below the 50% Fib retracement level of the upward wave from the $55,674 swing low to $60,050 high. It is now trading below $58,500 and the 100 hourly simple moving average.
An immediate support is near the $57,350 level. It is close to the 61.8% Fib retracement level of the upward wave from the $55,674 swing low to $60,050 high. The first major support is now forming near the $56,500 level. A downside break below the $56,500 level could spark more losses.
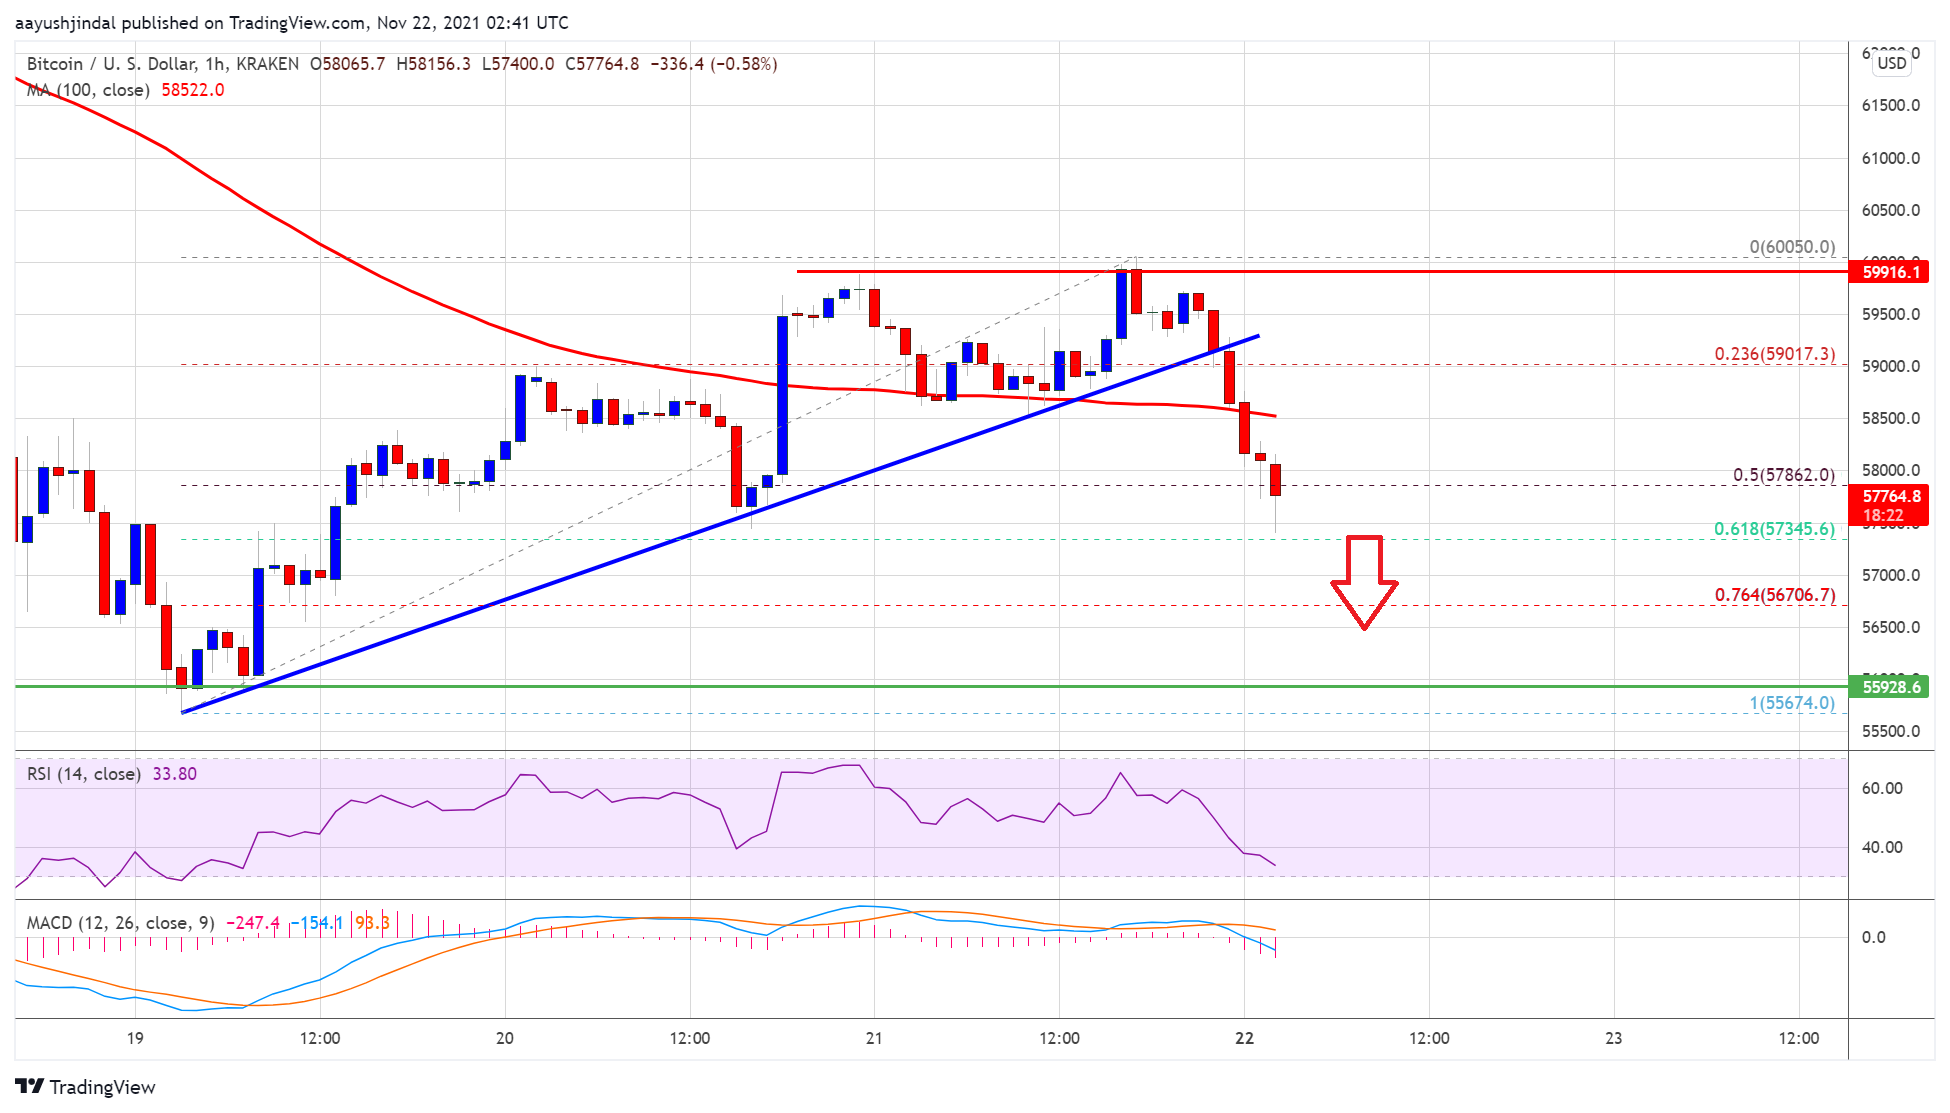
Source: BTCUSD on TradingView.com
The main support is near the $55,500 and $55,000 levels. Any more losses may perhaps set the pace for a move towards the $52,000 support zone in the near term.
Fresh Recovery In BTC?
If bitcoin stays above the $56,500 support, it could start a fresh increase. On the upside, an initial resistance is near the $58,000 level.
The first key resistance is near the $58,500 level and the 100 hourly simple moving average. The next major resistance sits near the $59,200 level, above which the price might rise towards the $60,000 level. Any more gains could lead the price towards the $61,200 level.
Technical indicators:
Hourly MACD – The MACD is now gaining pace in the bearish zone.
Hourly RSI (Relative Strength Index) – The RSI for BTC/USD is now below the 50 level.
Major Support Levels – $56,500, followed by $55,500.
Major Resistance Levels – $58,500, $59,200 and $60,000.