
Reason to trust
How Our News is Made
Strict editorial policy that focuses on accuracy, relevance, and impartiality
Ad discliamer
Morbi pretium leo et nisl aliquam mollis. Quisque arcu lorem, ultricies quis pellentesque nec, ullamcorper eu odio.
Bitcoin price started a downside correction below $63,500 against the US Dollar. BTC must surpass $62,500 to start a fresh increase in the near term.
- Bitcoin is facing resistance near the $62,500 and $63,000 levels.
- The price is now trading above $62,000 and the 100 hourly simple moving average.
- There is a key bearish trend line forming with resistance near $62,250 on the hourly chart of the BTC/USD pair (data feed from Kraken).
- The pair could start a fresh rally if there is a clear break above $62,500.
Bitcoin Price Faces Resistance
Bitcoin price started a downside correction below the $62,500 and $62,250 levels. BTC declined below $62,000 and the 100 hourly simple moving average.
It tested the $60,600 zone. A low is formed near $60,644 and the price is now correcting higher. There was a break above the $61,500 resistance zone. Bitcoin surpassed the 23.6% Fib retracement level of the recent decline from the $64,325 swing high to $60,644 low.
It is now trading above $62,000 and the 100 hourly simple moving average. On the upside, an immediate resistance is near the $62,250 level. There is also a key bearish trend line forming with resistance near $62,250 on the hourly chart of the BTC/USD pair.
The first major resistance is near the $62,500 level. It is near the 76.4% Fib retracement level of the recent decline from the $64,325 swing high to $60,644 low.
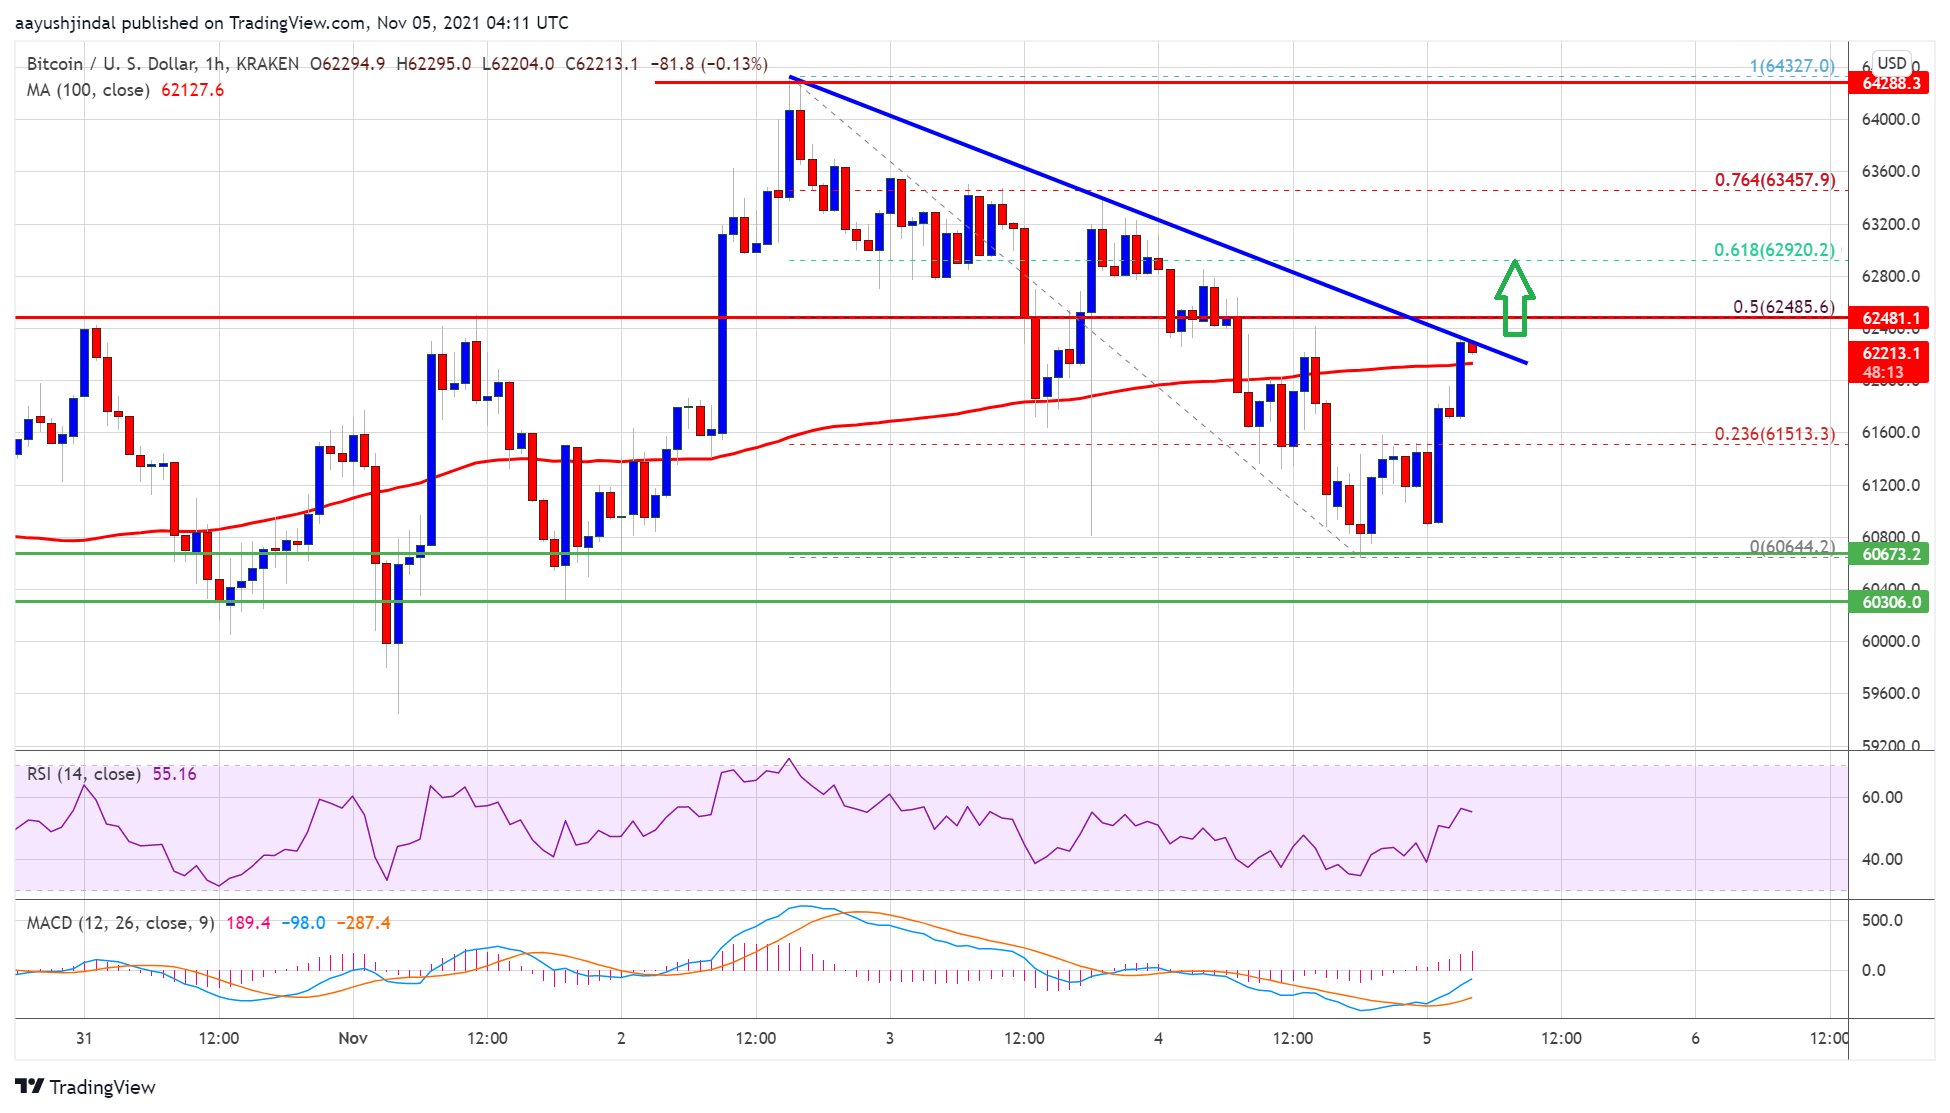
Source: BTCUSD on TradingView.com
A clear break above $62,500 resistance may possibly call open the doors for a fresh rally. The next major resistance sits near the $63,500 level. Any more gains might lead the price towards the $64,000 level.
Fresh Dip In BTC?
If bitcoin fails to clear the $62,500 resistance zone, it could start a fresh decline. An immediate support on the downside is near the $62,000 level.
The first major support is now forming near the $61,500 level. A clear close below the $61,500 support could open the doors for a move towards the $60,500 level. The main breakdown support is near $60,000, below which the price could accelerate losses.
Technical indicators:
Hourly MACD – The MACD is slowly gaining pace in the bullish zone.
Hourly RSI (Relative Strength Index) – The RSI for BTC/USD is now above the 50 level.
Major Support Levels – $61,500, followed by $60,500.
Major Resistance Levels – $62,250, $62,500 and $63,500.