
Reason to trust
How Our News is Made
Strict editorial policy that focuses on accuracy, relevance, and impartiality
Ad discliamer
Morbi pretium leo et nisl aliquam mollis. Quisque arcu lorem, ultricies quis pellentesque nec, ullamcorper eu odio.
Bitcoin started an upside correction above the $48,000 resistance zone against the US Dollar. BTC could gain pace if there is a close above the $50,000 level.
- Bitcoin started a decent increase above the $47,500 and $48,000 levels.
- The price is now trading above $48,500 and the 100 hourly simple moving average.
- There was a break above a connecting bearish trend line with resistance near $48,200 on the hourly chart of the BTC/USD pair (data feed from Kraken).
- The pair could accelerate higher if there is a close above the $50,000 resistance zone.
Bitcoin Price Starts Recovery
Bitcoin price started a recovery wave above the $47,500 resistance zone. BTC bulls gained strength for a move above the $48,000 resistance zone.
The upward move was such that the price broke the Fib retracement level of the recent decline from the $48,762 swing high to $46,666 low. Besides, there was a break above a connecting bearish trend line with resistance near $48,200 on the hourly chart of the BTC/USD pair.
Bitcoin price is now trading above $48,500 and the 100 hourly simple moving average. It is testing the $49,250 resistance zone. It seems like the 1.236 Fib extension level of the recent decline from the $48,762 swing high to $46,666 low is acting as a resistance.
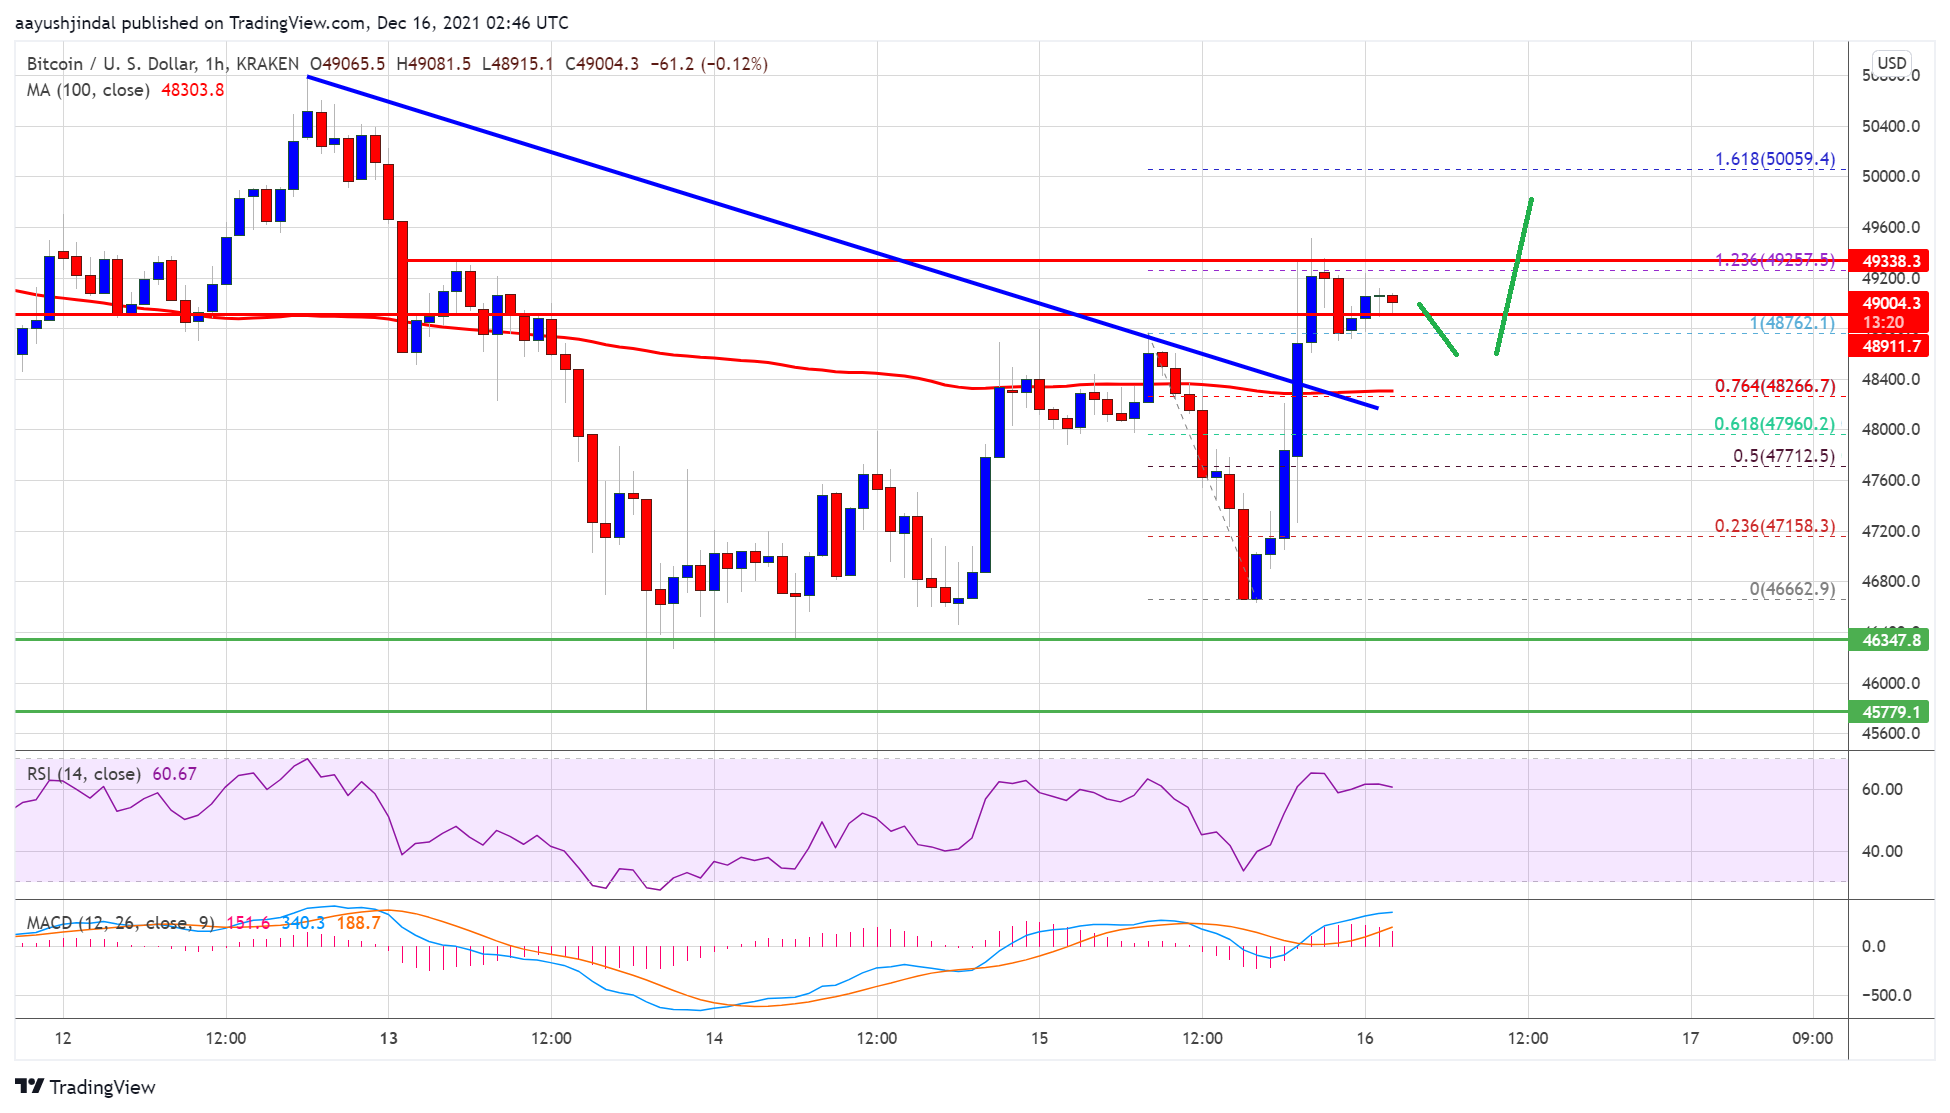
Source: BTCUSD on TradingView.com
The first major resistance is near the $49,500 level. The next key resistance could be $50,000. A proper break above the $50,000 resistance could open the doors for more upsides. The next key resistance is near the $51,200 level, above which the price may possibly rise towards $52,000.
Dips Limited In BTC?
If bitcoin fails to clear the $49,250 resistance zone, it could start a downside correction. An immediate support on the downside is near the $48,250 level and the 100 hourly SMA.
The first major support is now forming near the $48,000 level. The main support is now near $47,500. A downside break below the $47,500 support may perhaps start a fresh decline in the near term. In the stated case, it could decline towards the $45,000 support zone.
Technical indicators:
Hourly MACD – The MACD is slowly losing pace in the bullish zone.
Hourly RSI (Relative Strength Index) – The RSI for BTC/USD is currently above the 50 level.
Major Support Levels – $48,250, followed by $47,500.
Major Resistance Levels – $49,250, $50,000 and $52,000.