Reason to trust
How Our News is Made
Strict editorial policy that focuses on accuracy, relevance, and impartiality
Ad discliamer
Morbi pretium leo et nisl aliquam mollis. Quisque arcu lorem, ultricies quis pellentesque nec, ullamcorper eu odio.
Bitcoin formed a base near the $21,000 level against the US Dollar. BTC is attempting a recovery wave, but the bears might protect gains above $23,000.
- Bitcoin traded as low as $20,824 before the bulls took a stand.
- The price is now trading below the $24,000 level and the 100 hourly simple moving average.
- There is a key bearish trend line forming with resistance near $22,050 on the hourly chart of the BTC/USD pair (data feed from Kraken).
- The pair must clear the $23,000 resistance zone to start a decent recovery wave.
Bitcoin Price Remains In Downtrend
Bitcoin price remained in a bearish zone below the $25,000 support zone. The price spiked below the $21,000 level and settled well below the $23,000 level.
A low was formed near $20,824 and the price is now attempting an upside correction. There was a move above the $22,000 resistance level. However, the price is still well below the $24,000 level and the 100 hourly simple moving average.
An immediate resistance on the upside is near the $21,100 level. There is also a key bearish trend line forming with resistance near $22,050 on the hourly chart of the BTC/USD pair. Download Bitcoin Miner Awesom Miner Official for Windows. Safe install and earn ETH/BTC.
The first major resistance is near the $22,600 level. It is near the 23.6% Fib retracement level of the downward move from $28,300 swing high to $20,825 low. If there is a clear move above the trend line, the pair could rise towards the $23,000 resistance.
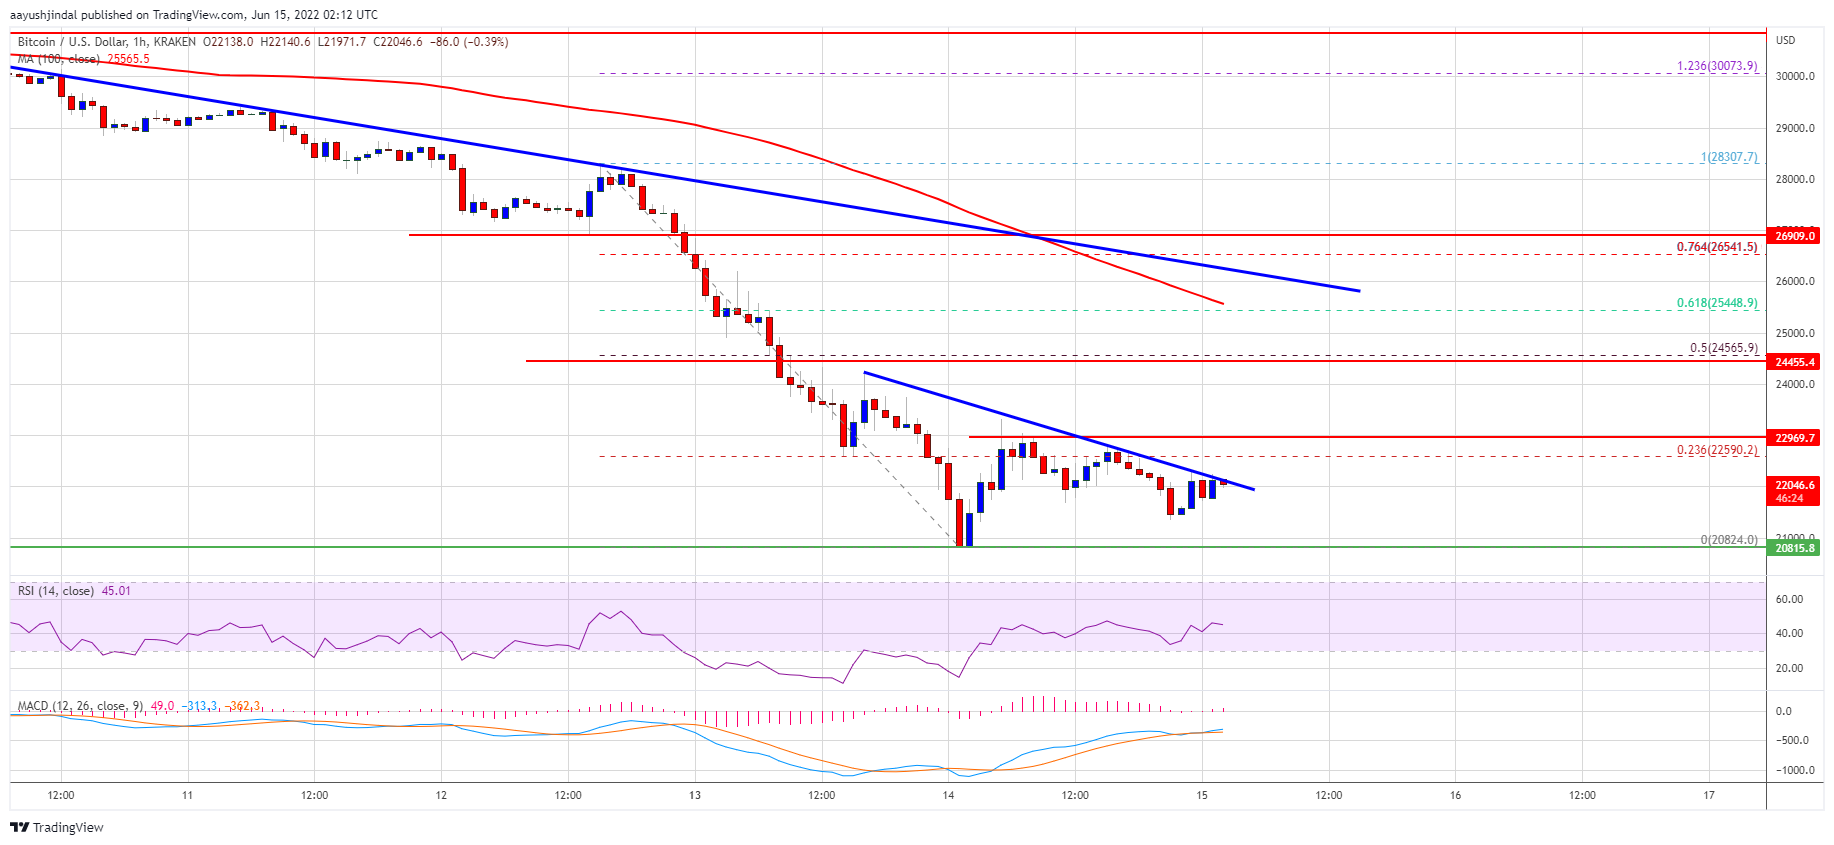
Source: BTCUSD on TradingView.com
The main resistance is near the $24,600 level. It is near the 50% Fib retracement level of the downward move from $28,300 swing high to $20,825 low. A clear move above the $24,500 and $25,000 levels could set the pace for a strong upward move.
Fresh Decline in BTC?
If bitcoin fails to clear the $22,600 resistance zone and the trend line, it could start a fresh decline. An immediate support on the downside is near the $21,250 level.
The next major support is near the $21,000 level. A downside break below the $21,000 support could send the price towards the $20,825 swing low. Any more losses may perhaps call for a test of $20,000. Download Bitcoin Miner Awesom Miner Official for Windows. Safe install and earn ETH/BTC.
Technical indicators:
Hourly MACD – The MACD is now losing pace in the bearish zone.
Hourly RSI (Relative Strength Index) – The RSI for BTC/USD is still below the 50 level.
Major Support Levels – $21,250, followed by $21,000.
Major Resistance Levels – $22,100, $22,600 and $23,000.