Reason to trust
How Our News is Made
Strict editorial policy that focuses on accuracy, relevance, and impartiality
Ad discliamer
Morbi pretium leo et nisl aliquam mollis. Quisque arcu lorem, ultricies quis pellentesque nec, ullamcorper eu odio.
Bitcoin price failed to clear the $37,500 and $37,800 resistance levels against the US Dollar. BTC is currently moving lower and it could continue to move down towards $34,000 or $33,000.
- Bitcoin is facing a strong resistance near the $37,800 and $38,000 resistance levels.
- The price is now trading below the $36,500 support and the 100 hourly simple moving average.
- There was a break below a major contracting triangle with support near $36,500 on the hourly chart of the BTC/USD pair (data feed from Kraken).
- The pair is showing bearish signs and it could decline further towards $34,000 or $33,000.
Bitcoin Price is Grinding Lower
After another failed attempt above the $37,000 resistance, bitcoin price started a fresh decline. A swing high was formed near $37,861 before the price corrected lower.
It broke the $37,000 and $36,800 support levels. More importantly, there was a break below a major contracting triangle with support near $36,500 on the hourly chart of the BTC/USD pair. The price is now trading below the $36,500 support and the 100 hourly simple moving average.
An initial support on the downside is near the $35,850 level. It is close to the 50% Fib retracement level of the upward move from the $33,878 swing low to $37,861 high.
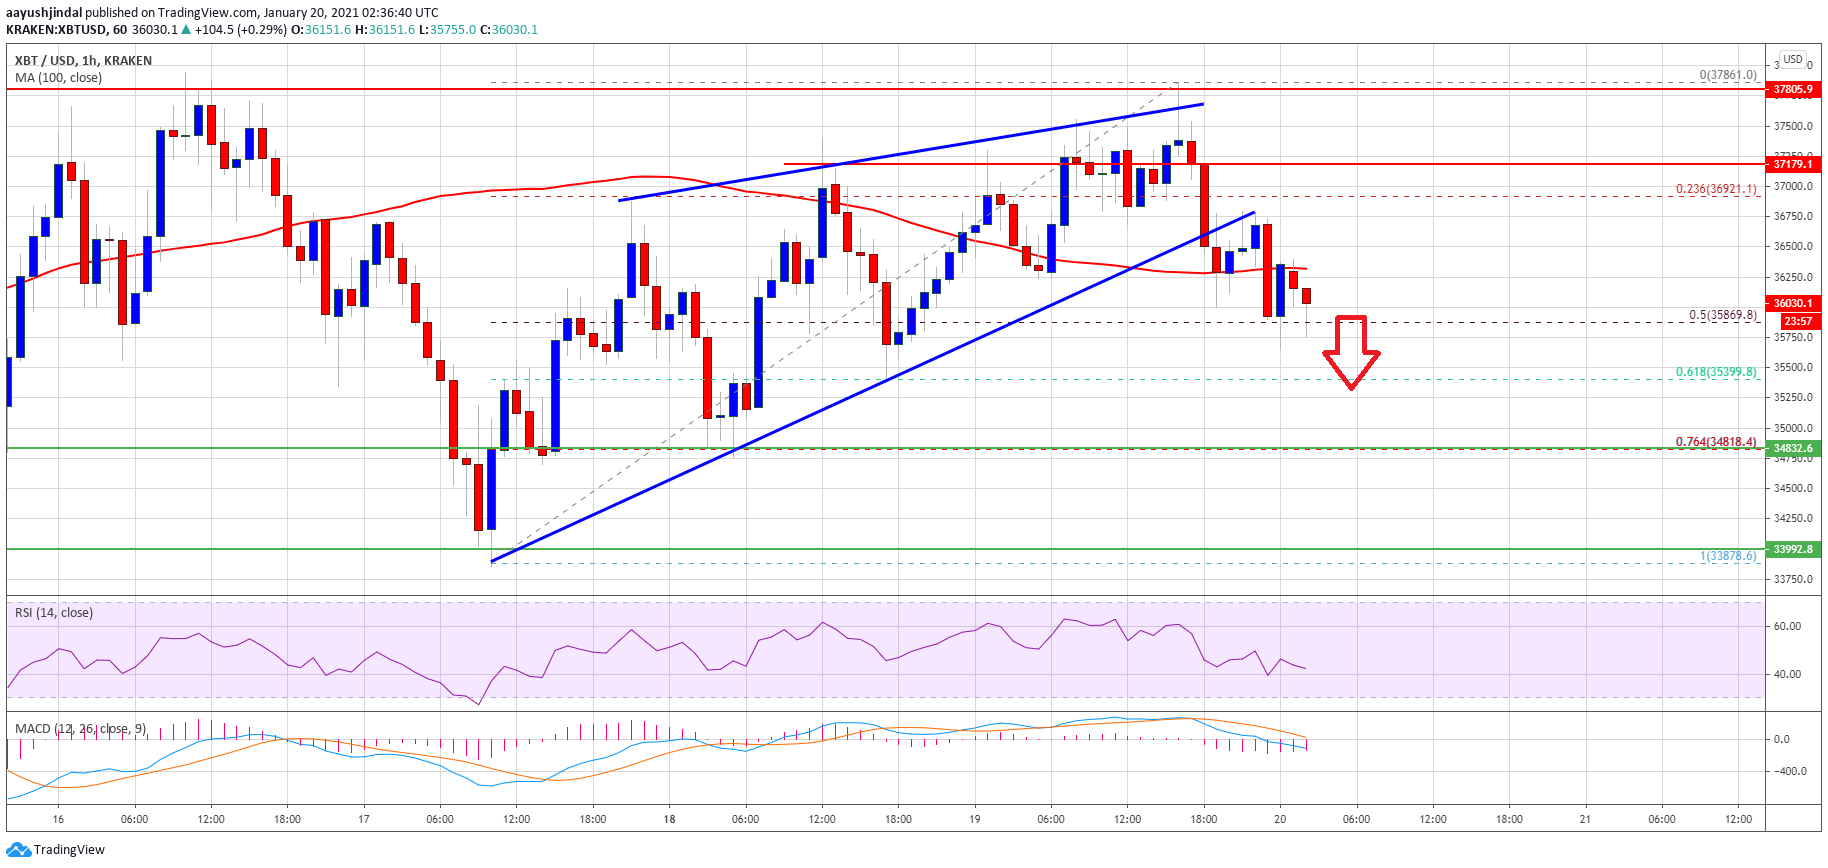
Source: BTCUSD on TradingView.com
If bitcoin price fails to stay above the $38,850 support, it could continue to move down towards $35,000. The next major support is near the $34,800 level, below which the price is likely to decline towards the $33,200 support zone in the coming sessions.
Fresh Increase in BTC?
If bitcoin starts a fresh upward move, an initial resistance is near the $36,350 level and the 100 hourly simple moving average. The first major resistance is near the $36,800 level (the recent breakdown zone).
The main resistance on the upside is still above the $37,000 zone at $37,500 and $37,800. A successful close above the $37,000 resistance and then a follow up move above the $37,500 could open the doors for a larger increase I the near term.
Technical indicators:
Hourly MACD – The MACD is slowly gaining momentum in the bearish zone.
Hourly RSI (Relative Strength Index) – The RSI for BTC/USD is now well below the 50 level.
Major Support Levels – $35,800, followed by $34,800.
Major Resistance Levels – $36,800, $37,000 and $37,500.