Reason to trust
How Our News is Made
Strict editorial policy that focuses on accuracy, relevance, and impartiality
Ad discliamer
Morbi pretium leo et nisl aliquam mollis. Quisque arcu lorem, ultricies quis pellentesque nec, ullamcorper eu odio.
Bitcoin price started a fresh increase and it cleared the $58,250 resistance against the US Dollar. BTC is now showing positive signs and it might soon revisit $60,000.
- Bitcoin started a fresh increase above the $58,000 and $58,250 resistance levels.
- The price is now trading nicely above $58,250 and the 100 hourly simple moving average.
- There was a break above a major bearish trend line with resistance near $58,650 on the hourly chart of the BTC/USD pair (data feed from Kraken).
- The pair is now consolidating above the 100 hourly SMA and it might continue higher towards $60,000.
Bitcoin Price Breaks Key Resistance
Bitcoin formed a support base above the $57,000 level and recently started a fresh increase. BTC broke a couple of key hurdles near $57,500 and $58,250 to move into a positive zone.
There was a break above the $58,500 resistance zone and the 100 hourly simple moving average. Moreover, there was a break above a major bearish trend line with resistance near $58,650 on the hourly chart of the BTC/USD pair.
The pair settled nicely above the $58,250 level and the 100 hourly SMA. It traded as high as $59,467 and it is currently consolidating gains. It is trading just below the 23.6% Fib retracement level of the recent wave from the $56,810 low to $59,467 high.
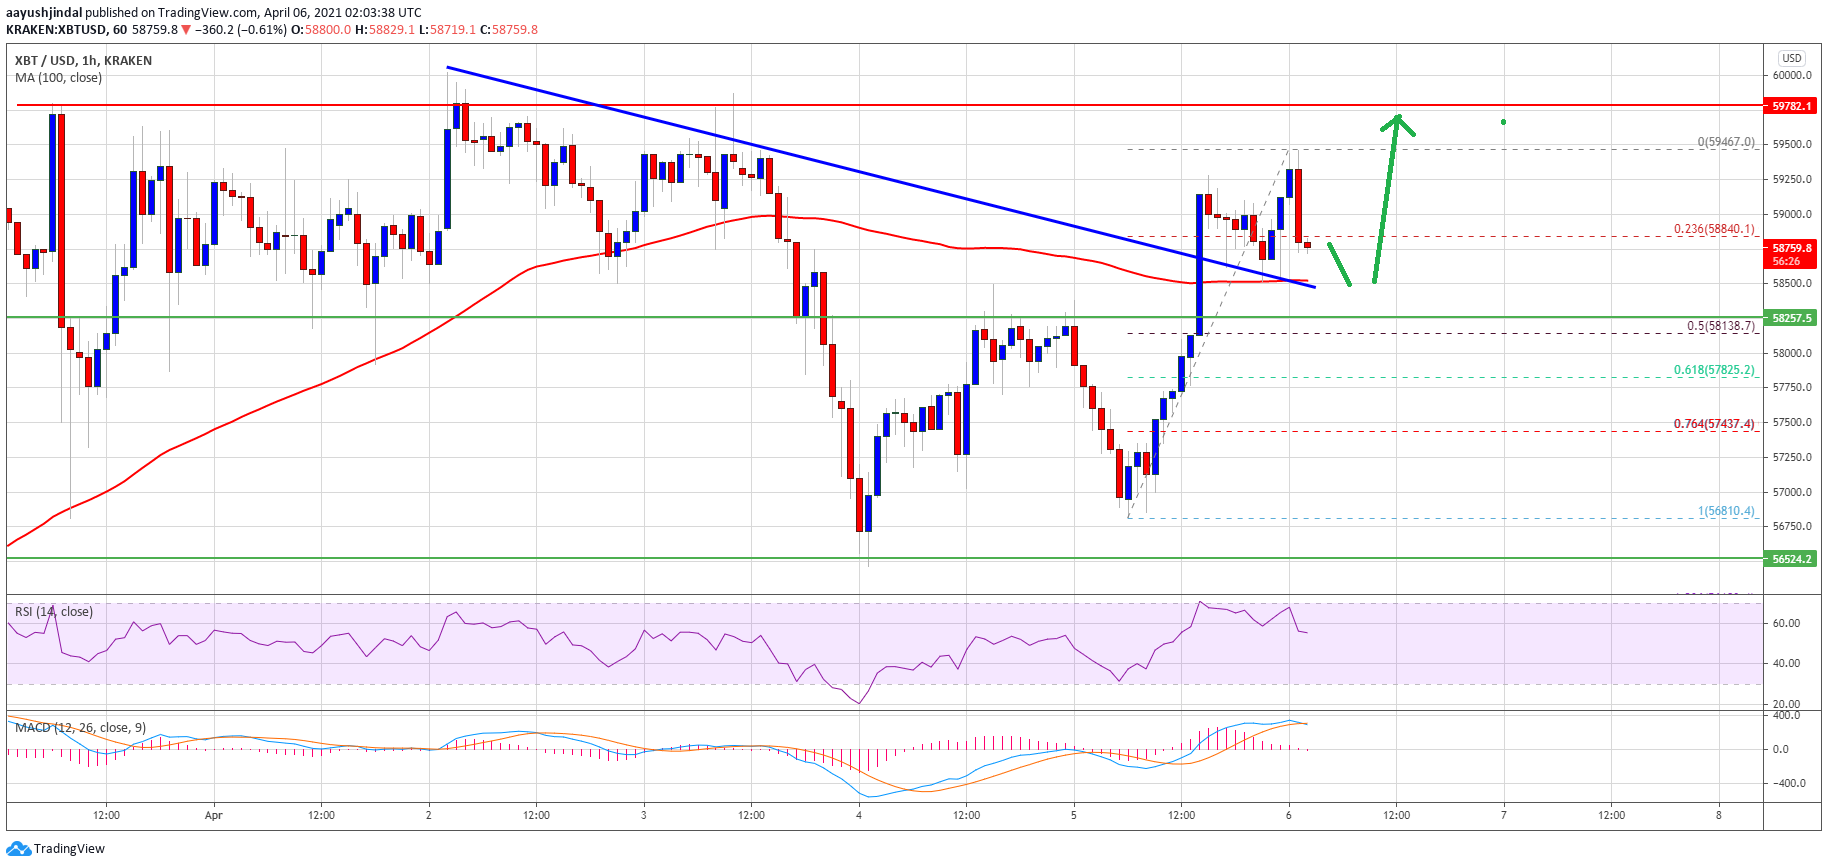
Source: BTCUSD on TradingView.com
An initial support is near the $58,500 level and the 100 hourly simple moving average. An immediate resistance is near the $59,000 level, followed by the $59,467 high.
The main resistance is still near the $60,000 level. If there is an upside break above $60,000, there are chances of a steady increase towards the $62,000 zone in the near term.
Dips Limited in BTC?
If bitcoin fails to climb above $59,000 and $59,500, there could be a downside correction. The first major support on the downside is near the $58,500 level and the 100 hourly SMA.
The next major support is near the $58,250 level (the recent breakout zone). It is close to the 50% Fib retracement level of the recent wave from the $56,810 low to $59,467 high. Any more losses might lead the price towards the $57,500 support zone in the coming sessions.
Technical indicators:
Hourly MACD – The MACD is slowly losing momentum in the bullish zone.
Hourly RSI (Relative Strength Index) – The RSI for BTC/USD is now above the 50 level.
Major Support Levels – $58,500, followed by $58,250.
Major Resistance Levels – $59,000, $59,500 and $60,000.