
Reason to trust
How Our News is Made
Strict editorial policy that focuses on accuracy, relevance, and impartiality
Ad discliamer
Morbi pretium leo et nisl aliquam mollis. Quisque arcu lorem, ultricies quis pellentesque nec, ullamcorper eu odio.
Bitcoin price extended its decline below the $54,000 level against the US Dollar. BTC is holding the $52,500 support, but it must clear $54,000 for a fresh increase.
- Bitcoin failed to stay above the $54,000 support and extended its decline.
- The price is now facing resistance near $54,000 and the 100 hourly simple moving average.
- There is a major declining channel forming with resistance near $54,000 on the hourly chart of the BTC/USD pair (data feed from Kraken).
- The pair could either rally above $54,000 or it might extend its decline towards $50,000.
Bitcoin Price is Facing Hurdles
Bitcoin struggled to continue higher above $55,000 and it started a fresh decline. BTC broke the $54,000 and $53,500 support levels.
There was also a close below the $54,000 level and the 100 hourly simple moving average. The price tested the $52,500 support zone. A low is formed near $52,375 and the price is now consolidating losses. It recovered above the $53,200 level.
There was a break above the 23.6% Fib retracement level of the downward move from the $56,545 swing high to $52,375 low. It seems like the price is now facing resistance near $54,000 and the 100 hourly simple moving average.
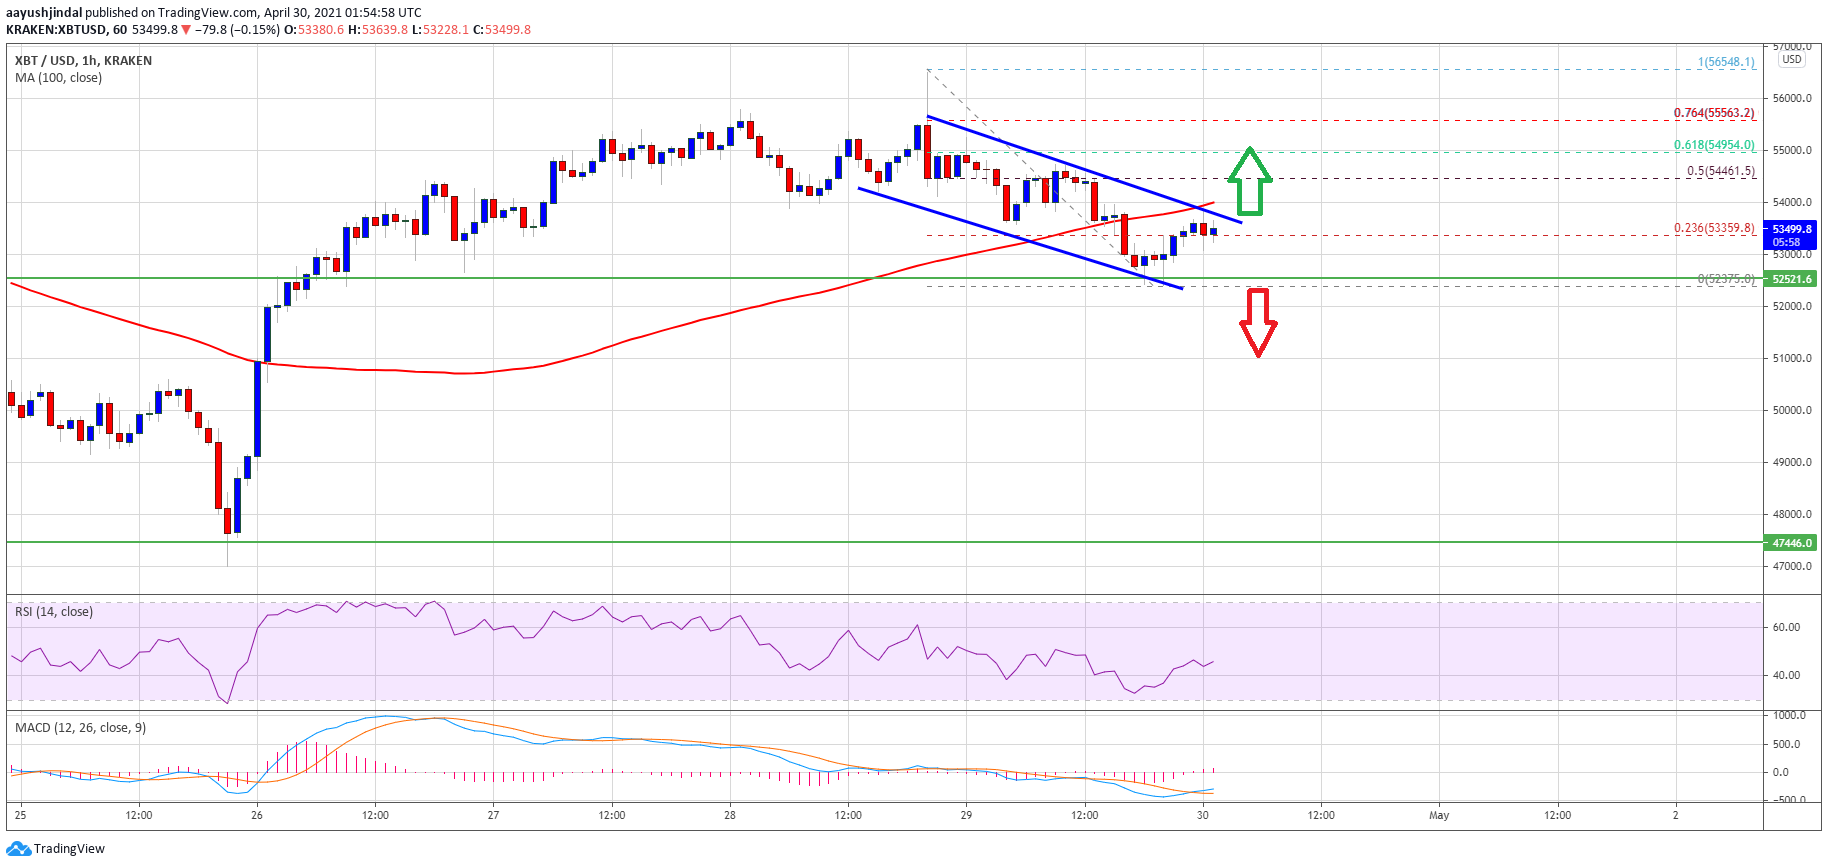
Source: BTCUSD on TradingView.com
There is also a major declining channel forming with resistance near $54,000 on the hourly chart of the BTC/USD pair. The next major resistance is near the $54,500 level. It is near the 50% Fib retracement level of the downward move from the $56,545 swing high to $52,375 low.
A successful break above the channel resistance and then a break above the $54,500 level could set the pace for a fresh increase towards the $56,500 level. The next major resistance above $56,500 could be $58,000.
More Losses in BTC?
If bitcoin fails to clear the $54,000 resistance and the 100 hourly SMA, there is a risk of more downsides. An initial support on the downside is near the $52,500 level.
A proper break and close below the $52,500 level is likely to set the pace for another 5% decline. In the stated case, the price could decline towards the $50,000 support zone in the near term.
Technical indicators:
Hourly MACD – The MACD is now losing pace in the bearish zone.
Hourly RSI (Relative Strength Index) – The RSI for BTC/USD is rising towards the 50 level.
Major Support Levels – $52,500, followed by $50,000.
Major Resistance Levels – $54,000, $54,500 and $56,500.