
Reason to trust
How Our News is Made
Strict editorial policy that focuses on accuracy, relevance, and impartiality
Ad discliamer
Morbi pretium leo et nisl aliquam mollis. Quisque arcu lorem, ultricies quis pellentesque nec, ullamcorper eu odio.
Bitcoin failed to test the $40,000 resistance zone against the US Dollar. BTC is now declining and might slide towards the $36,000 support zone.
- Bitcoin started a fresh decline after it failed to clear the $39,250 resistance zone.
- The price is now trading below $38,000 and the 100 hourly simple moving average.
- There was a break below a major bullish trend line with support near $37,500 on the hourly chart of the BTC/USD pair (data feed from Kraken).
- The pair could continue to decline towards the $36,000 support or even $35,500.
Bitcoin Price Tops Below $40K
Bitcoin price attempted a move towards the $40,000 resistance zone. However, BTC failed to gain pace above the $39,250 zone. A high was formed near $39,290 and the price started a fresh decline.
There was a clear move below the $38,000 support level and the 100 hourly simple moving average. Besides, there was a break below a major bullish trend line with support near $37,500 on the hourly chart of the BTC/USD pair.
The pair traded below the 76.4% Fib retracement level of the key move from the $36,665 swing low to $39,290 high. It is now showing a few bearish signs below the $37,000 level. On the upside, an initial resistance is near the $37,200 level.
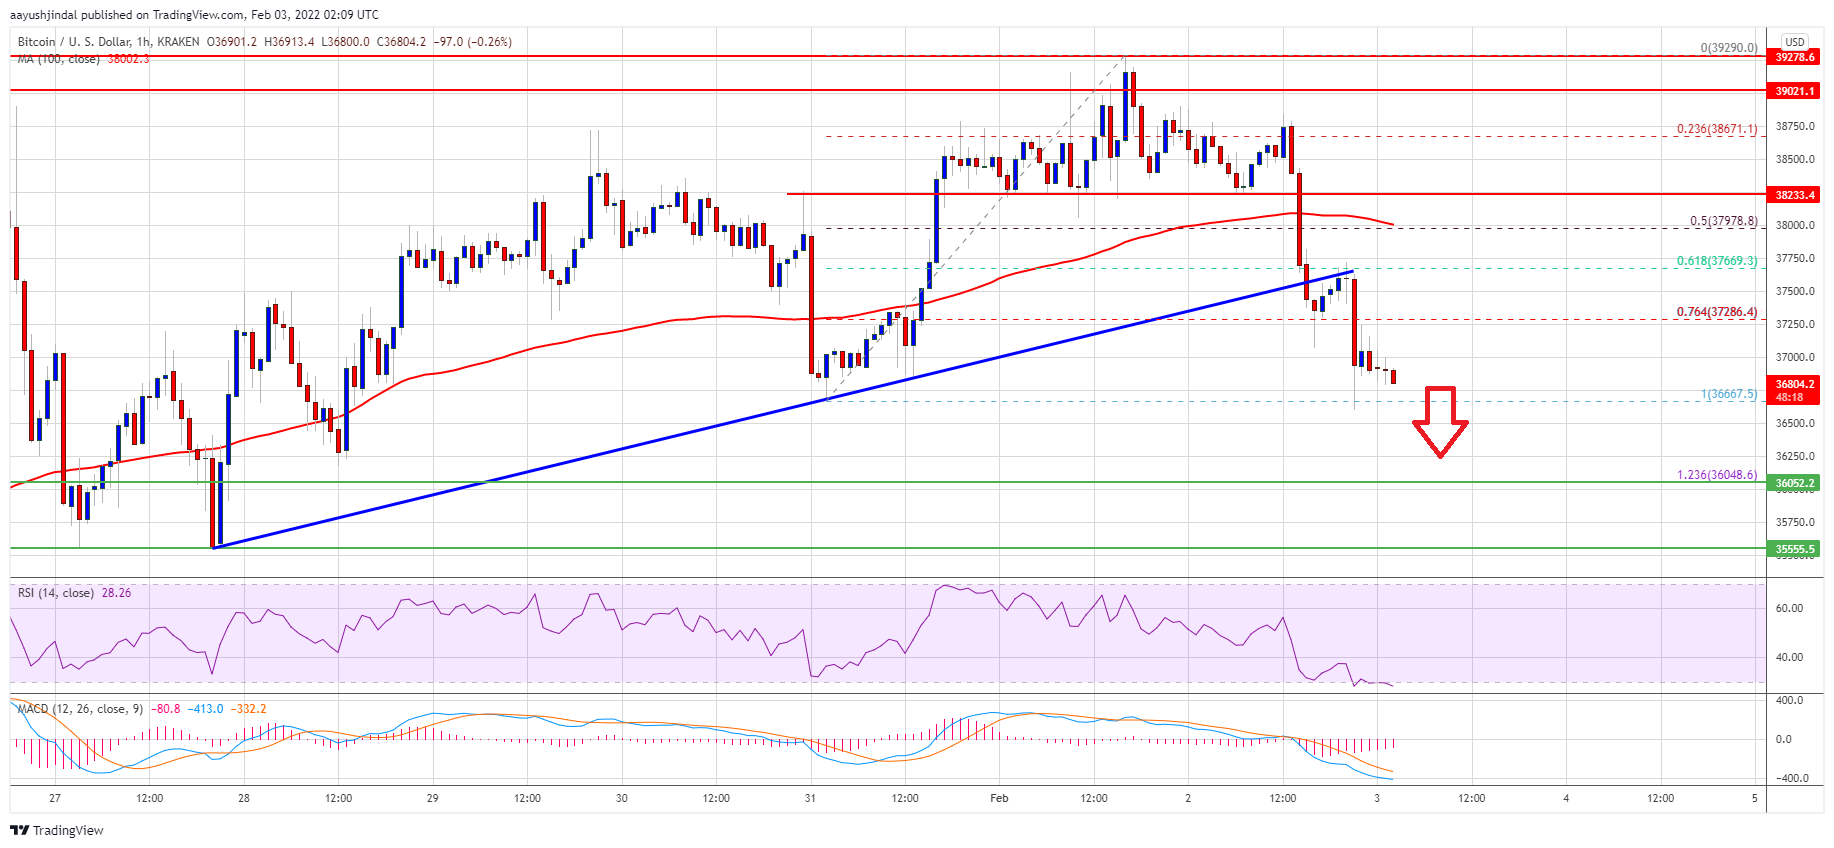
Source: BTCUSD on TradingView.com
The first major resistance is near the $37,500 zone. The main hurdle is now forming near the $38,000 zone and the 100 hourly simple moving average (the recent breakdown zone). A clear move above the $38,000 resistance could start a fresh increase. In the stated case, the price could revisit the $39,250 level.
More Losses in BTC?
If bitcoin fails to start a fresh increase above $38,000, it could continue to move down. An immediate support on the downside is near the $36,650 zone.
The first major support is seen near the $36,000 zone. It is near the 1.236 Fib extension level of the key move from the $36,665 swing low to $39,290 high. Any more losses might call for a move towards the $35,500 support zone in the near term. A downside break below the $35,500 support zone may perhaps call for a drop to $33,200.
Technical indicators:
Hourly MACD – The MACD is now gaining momentum in the bearish zone.
Hourly RSI (Relative Strength Index) – The RSI for BTC/USD is well below the 50 level.
Major Support Levels – $36,000, followed by $35,500.
Major Resistance Levels – $37,500, $38,000 and $39,250.