Reason to trust
How Our News is Made
Strict editorial policy that focuses on accuracy, relevance, and impartiality
Ad discliamer
Morbi pretium leo et nisl aliquam mollis. Quisque arcu lorem, ultricies quis pellentesque nec, ullamcorper eu odio.
Bitcoin price failed to clear the $10,800 resistance and started a fresh decline against the US Dollar. BTC could continue to move down below $10,500 as long as it is below the 100 hourly SMA.
- Bitcoin failed to hold gains and started a fresh decline from the $10,800 resistance level.
- The price broke the $10,650 support and settled below the 100 hourly simple moving average.
- This week’s important ascending channel was breached with support near $10,700 on the hourly chart of the BTC/USD pair (data feed from Kraken).
- The pair is currently holding the $10,550 support, but it remains at a risk of more losses.
Bitcoin Price Resumes Decline
Bitcoin price failed to clear the key $10,800 resistance and started a fresh decline against the US Dollar. BTC traded as high as $10,803 before the bulls lost control.
As a result, there was a bearish reaction below the $10,750 and $10,700 levels. The decline gained pace after this week’s important ascending channel was breached with support near $10,700 on the hourly chart of the BTC/USD pair.
Bitcoin traded below the 50% Fib retracement level of the upward move from the $10,387 swing low to $10,803 swing high. The price is now trading well below the $10,650 support and the 100 hourly simple moving average.
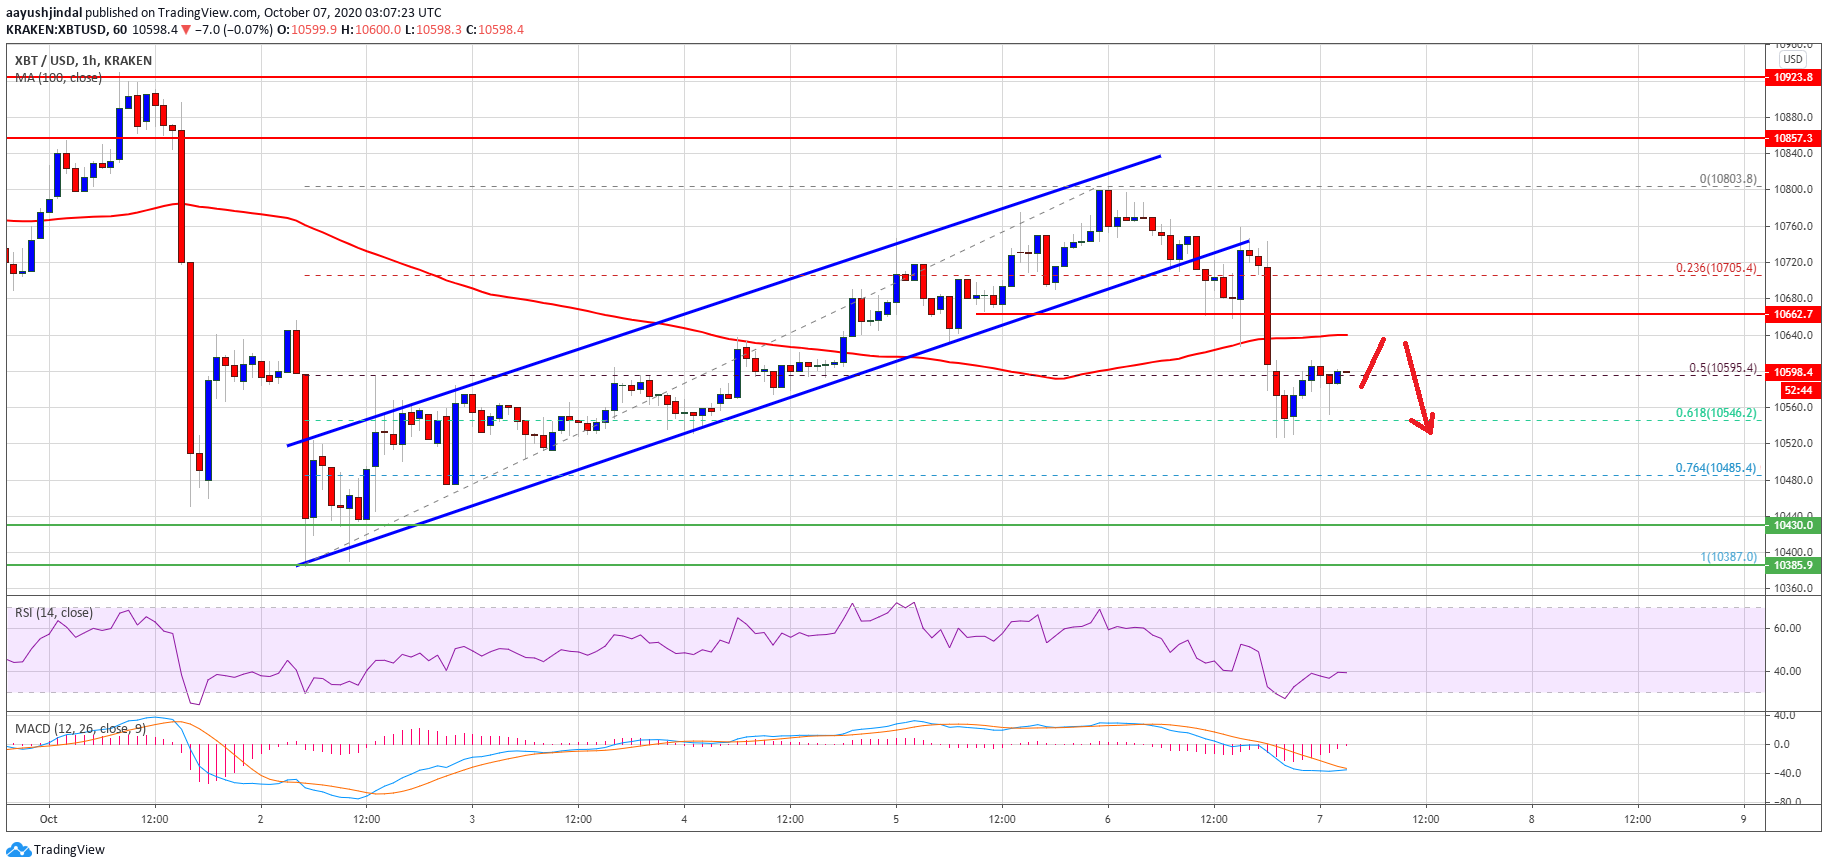
Bitcoin price dives below $10,650. Source: TradingView.com
It is currently holding the $10,550 support, but it remains at a risk of more losses. The $10,550 support is close to the 61.8% Fib retracement level of the upward move from the $10,387 swing low to $10,803 swing high.
If there is a downside break below the $10,550 support level, the bears are likely to aim a test of the $10,387 swing low. Any further losses might lead the price towards the $10,250 support or even $10,000 in the near term.
Upsides Capped in BTC?
If bitcoin starts an upside correction, it could face resistance near the $10,650 level and the 100 hourly simple moving average.
A proper close above the $10,650 and $10,680 levels might start a fresh increase. The next major resistance is near the $10,800 level, above which the bulls might aim a break above $10,950.
Technical indicators:
Hourly MACD – The MACD is slowly losing momentum in the bearish zone.
Hourly RSI (Relative Strength Index) – The RSI for BTC/USD is currently well below the 50 level.
Major Support Levels – $10,550, followed by $10,380.
Major Resistance Levels – $10,650, $10,800 and $10,950.


