
Reason to trust
How Our News is Made
Strict editorial policy that focuses on accuracy, relevance, and impartiality
Ad discliamer
Morbi pretium leo et nisl aliquam mollis. Quisque arcu lorem, ultricies quis pellentesque nec, ullamcorper eu odio.
Bitcoin price extended its decline below the $33,500 support against the US Dollar. BTC is now consolidating above $32,200, below which it could accelerate lower.
- Bitcoin started a fresh decline below the $33,500 and $33,200 support levels.
- The price is now trading below the $33,000 support and the 100 hourly simple moving average.
- There is a short-term contracting triangle forming with resistance near $33,000 on the hourly chart of the BTC/USD pair (data feed from Kraken).
- The pair could correct higher, but the bulls are likely to face resistance near $33,500.
Bitcoin Price Testing Key Support
Bitcoin failed to stay above the $33,500 support and it extended its decline. BTC even broke the $33,000 support zone and it settled well below the 100 hourly simple moving average.
The price even spiked below $32,200, but there was no follow through move. It is now consolidating losses above the $32,200 support zone. It is now approaching the 23.6% Fib retracement level of the recent decline from the $35,975 swing high to $32,150 low.
There is also a short-term contracting triangle forming with resistance near $33,000 on the hourly chart of the BTC/USD pair. The triangle support is near the $32,200 zone.
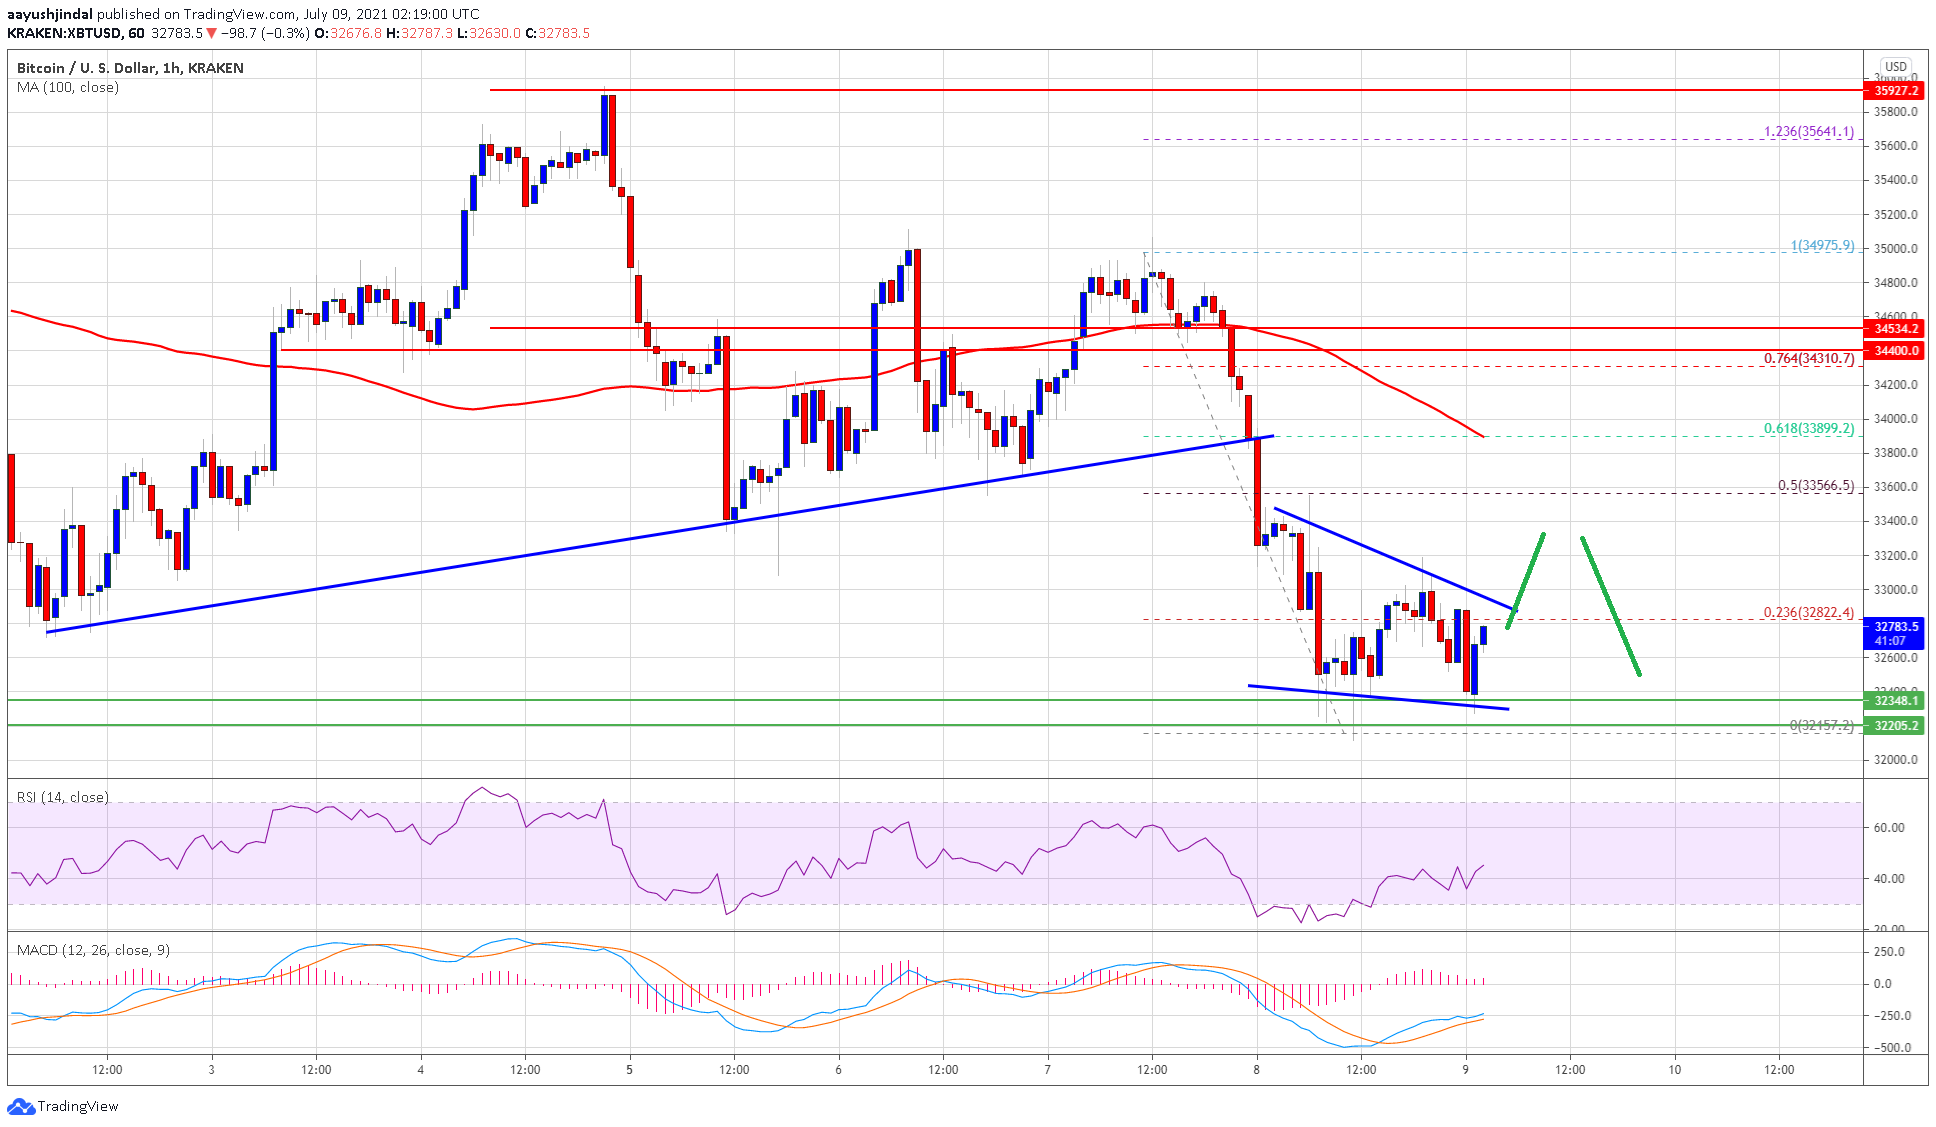
Source: BTCUSD on TradingView.com
Therefore, the first major support is near the $32,200 zone. The next key support is near the $32,000 level. If bitcoin price fails to stay above the $32,000 support, there could be a sharp decline. The next major support is near the $30,500 level. Any more losses might push the price below the main $30,000 support zone in the near term.
Upsides Limited in BTC?
If bitcoin remains stable above the $32,000 support zone, it could start an upside correction. An immediate resistance on the upside is near the $33,000 level.
The first major resistance is near $33,500. It is near the 50% Fib retracement level of the recent decline from the $35,975 swing high to $32,150 low. If there is a close above the $33,500 resistance zone, the price could rise towards the $34,000 resistance. The main hurdle is still near the $35,000 zone.
Technical indicators:
Hourly MACD – The MACD is now losing pace in the bearish zone.
Hourly RSI (Relative Strength Index) – The RSI for BTC/USD is now rising towards the 50 level.
Major Support Levels – $32,000, followed by $31,200.
Major Resistance Levels – $33,000, $33,500 and $34,000.


