
Reason to trust
How Our News is Made
Strict editorial policy that focuses on accuracy, relevance, and impartiality
Ad discliamer
Morbi pretium leo et nisl aliquam mollis. Quisque arcu lorem, ultricies quis pellentesque nec, ullamcorper eu odio.
Bitcoin price extended its recovery above the $43,500 level against the US Dollar. BTC is now facing a major barrier near $44,200 and $44,400.
- Bitcoin recovered above the $42,500 and $43,500 resistance levels.
- The price is now trading above $43,000 and the 100 hourly simple moving average.
- There is a rising channel forming with support near $43,340 on the hourly chart of the BTC/USD pair (data feed from Kraken).
- The pair could accelerate further higher if there is a clear break above the $44,400 resistance.
Bitcoin Price Revisits Resistance
Bitcoin price remained stable and extended its increase above the $43,000 level. BTC even broke the $43,500 level and settled above the 100 hourly simple moving average.
However, the price is still struggling to clear the $44,200 and $44,400 resistance levels. A high is formed near $44,100 and the price is now consolidating gains. It is now trading above $43,000 and the 100 hourly simple moving average.
An immediate support is near the $43,500 level. There is also a rising channel forming with support near $43,340 on the hourly chart of the BTC/USD pair.
The channel support is near the 23.6% Fib retracement level of the recent increase from the $40,891 swing low to $44,100 high. On the upside, an immediate resistance is near the $44,100 level.
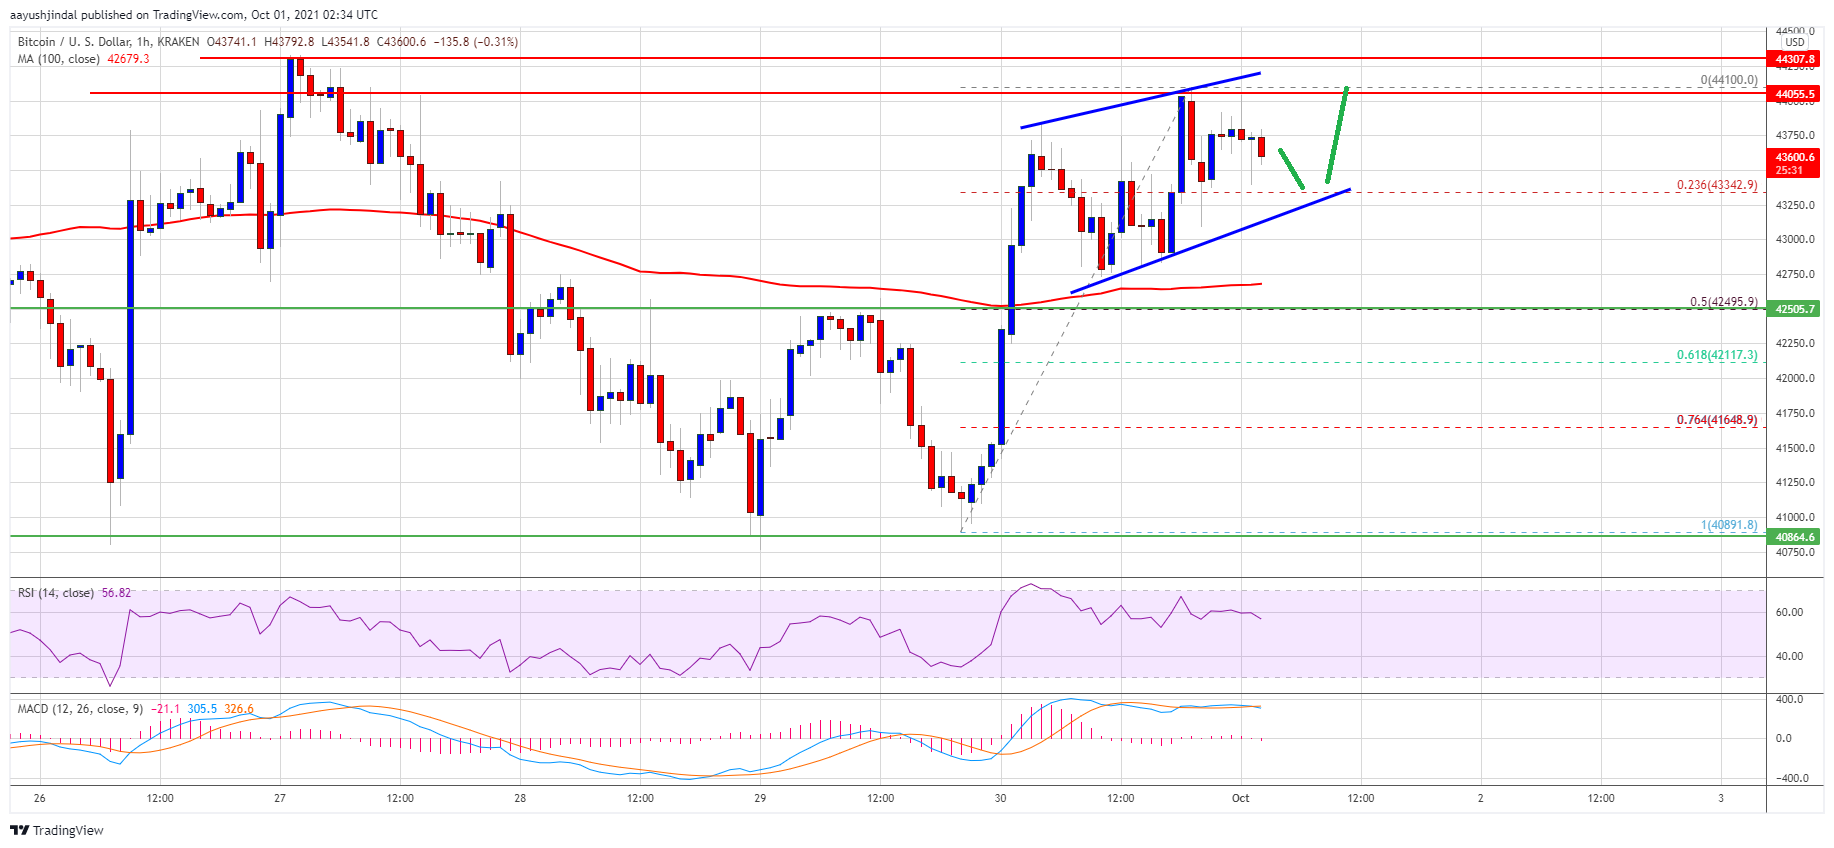
Source: BTCUSD on TradingView.com
The first major resistance is near the $44,400 level, above which the price could start a major increase. The next major resistance is near the $45,500 level. Any more gains could set the pace for a move towards the $47,200 level.
Fresh Decline In BTC?
If bitcoin fails to clear the $44,100 resistance zone, it could start a fresh downside correction. An immediate support on the downside is near the $43,500 level. The first major support is now forming near the $43,350 level and the channel trend line.
A break below the $43,350 level might push the price towards the $42,500 level. It is close to the 50% Fib retracement level of the recent increase from the $40,891 swing low to $44,100 high. Besides, the 100 hourly SMA is near the $42,500 zone to provide support.
Technical indicators:
Hourly MACD – The MACD is now losing pace in the bullish zone.
Hourly RSI (Relative Strength Index) – The RSI for BTC/USD is now well above the 50 level.
Major Support Levels – $43,350, followed by $42,500.
Major Resistance Levels – $44,100, $44,400 and $45,500.


