
Reason to trust
How Our News is Made
Strict editorial policy that focuses on accuracy, relevance, and impartiality
Ad discliamer
Morbi pretium leo et nisl aliquam mollis. Quisque arcu lorem, ultricies quis pellentesque nec, ullamcorper eu odio.
Bitcoin is forming a double bottom pattern near the $45,500 zone against the US Dollar. BTC is rising and there could be an upside break above $47,200.
- Bitcoin started an upside correction from the $45,500 support zone.
- The price is now trading near $47,000 and the 100 hourly simple moving average.
- There is a major bearish trend line forming with resistance near $47,000 on the hourly chart of the BTC/USD pair (data feed from Kraken).
- The pair could start a major increase if there is a clear move above the $47,000 resistance.
Bitcoin Price Forms Double Bottom
Bitcoin price declined again below the $46,500 level. BTC traded below the $46,000 level, but the bulls remained active near the $45,500 support zone.
A low was formed near $45,600 and the price is now recovering higher. It seems like the price is forming a double bottom pattern near the $45,500 zone. There was a move above the 23.6% Fib retracement level of the downward move from the $48,289 swing high to $45,600 low.
Bitcoin price is now trading near $47,000 and the 100 hourly simple moving average. It is facing resistance near the $47,000 zone. There is also a major bearish trend line forming with resistance near $47,000 on the hourly chart of the BTC/USD pair.
The trend line is near the 50% Fib retracement level of the downward move from the $48,289 swing high to $45,600 low. A clear move above the trend line could stage a strong move above $47,200.
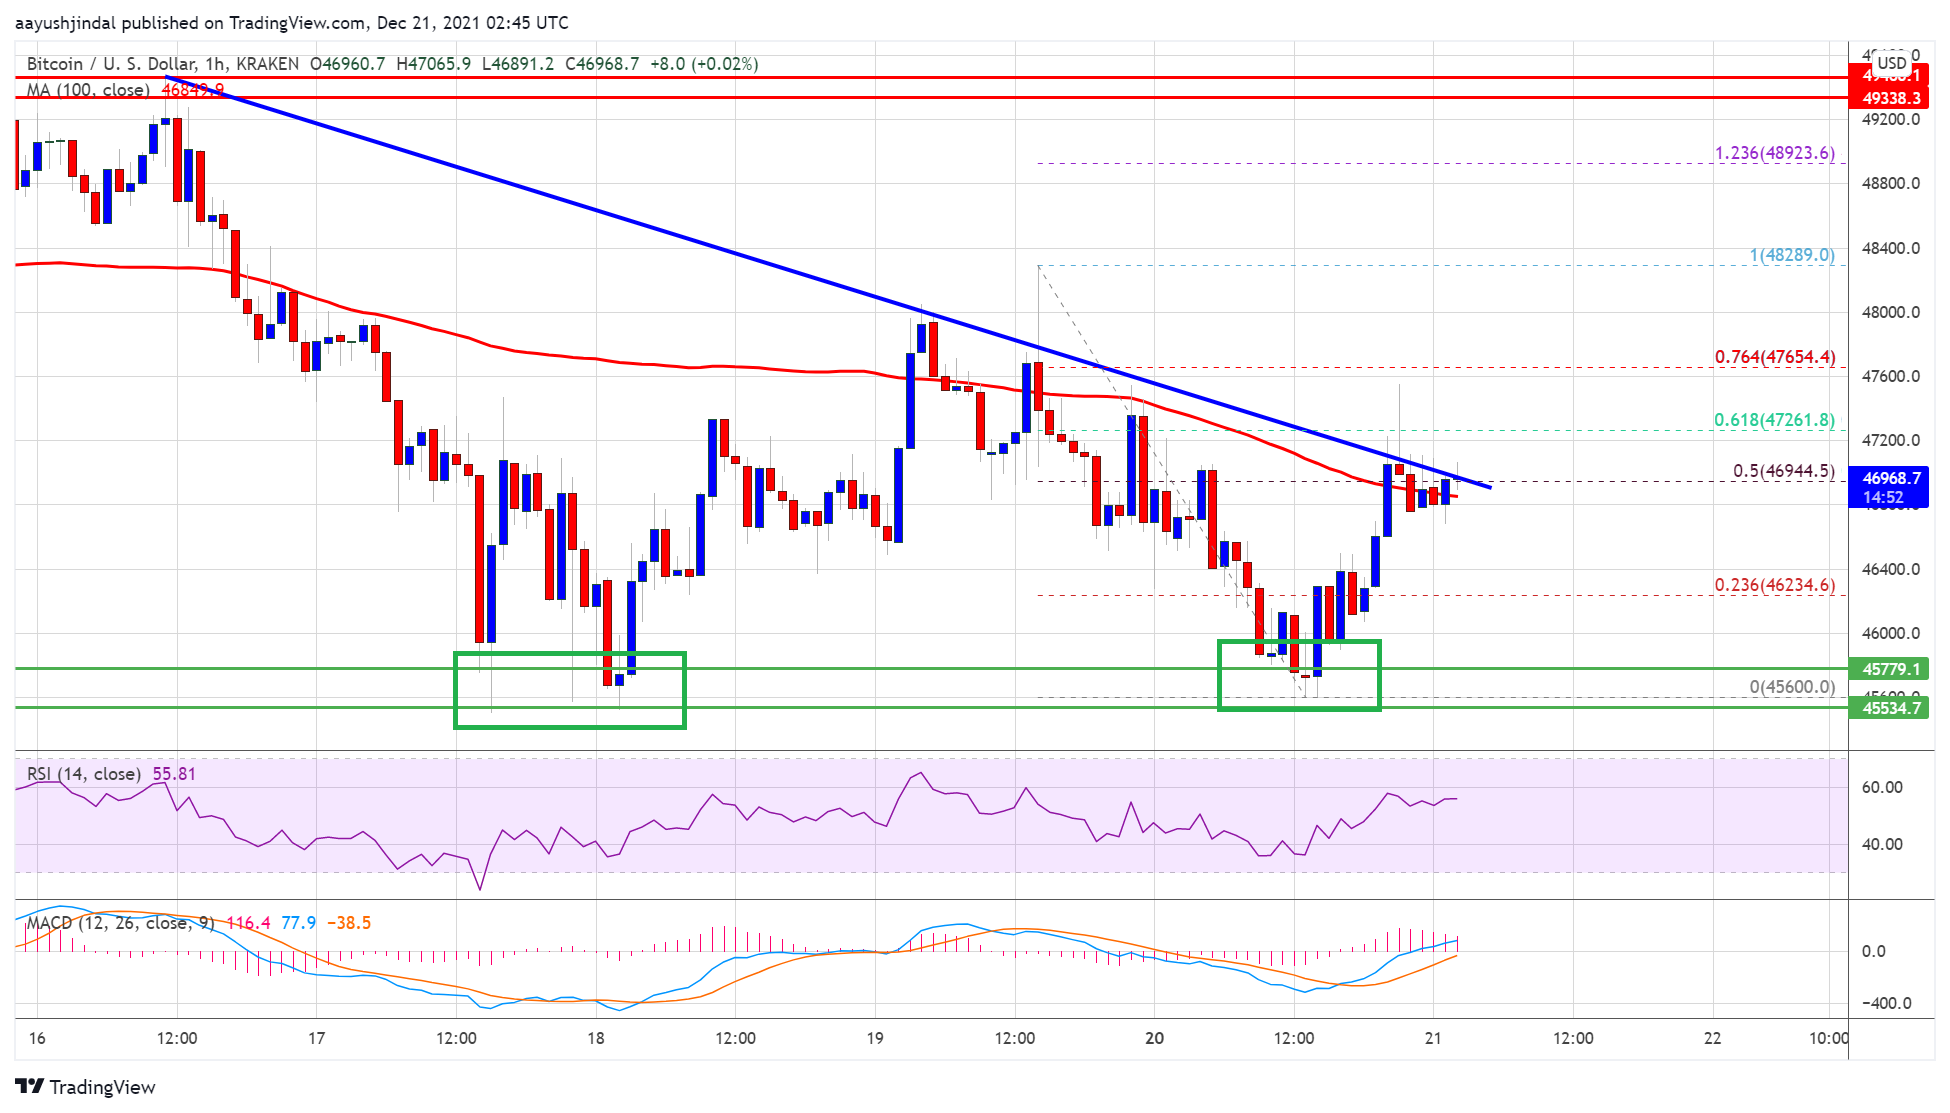
Source: BTCUSD on TradingView.com
The next key resistance could be $48,000, above which the price might rise towards the $48,500 resistance. If the stated double bottom pattern is valid, the price may possibly rise towards the $50,000 resistance zone.
Dips Limited In BTC?
If bitcoin fails to clear the $47,000 resistance zone, it could start a fresh decline. An immediate support on the downside is near the $46,500 level.
The first major support is near $46,200. A downside break below the $46,200 level could push the price towards the $45,500 support, where the bulls might remain active in the near term.
Technical indicators:
Hourly MACD – The MACD is slowly gaining pace in the bullish zone.
Hourly RSI (Relative Strength Index) – The RSI for BTC/USD is currently above the 50 level.
Major Support Levels – $46,200, followed by $45,500.
Major Resistance Levels – $47,000, $48,000 and $50,000.


