Reason to trust
How Our News is Made
Strict editorial policy that focuses on accuracy, relevance, and impartiality
Ad discliamer
Morbi pretium leo et nisl aliquam mollis. Quisque arcu lorem, ultricies quis pellentesque nec, ullamcorper eu odio.
Bitcoin price regained momentum and broke the $15,800 resistance against the US Dollar. BTC is trading nicely above the $15,500 support and the bulls seem to be aiming a break above $16,000.
- Bitcoin gained over 2% and it spiked above the $15,850 resistance zone.
- The price is currently trading well above the $15,500 support and the 100 hourly simple moving average.
- There is a crucial bullish trend line forming with support near $15,540 on the hourly chart of the BTC/USD pair (data feed from Kraken).
- The pair could rally above $15,850 and $16,000 as long as it is above the 100 hourly SMA.
Bitcoin Price Is Showing Positive Signs
Yesterday, we discussed the importance of the 100 hourly simple moving average and $15,200 for bitcoin price. BTC remained well bid above the 100 hourly SMA, it climbed above the $15,500 and $15,600 resistance levels.
The upward move gained pace above the $15,700 level and the price even spiked above the $15,850 resistance. It traded close to the $16,000 resistance and formed a new weekly high at $15,995. Bitcoin is currently correcting lower and trading below $15,850.
There was a break below the 23.6% Fib retracement level of the recent increase from the $15,098 swing low to $15,995 high. The first key support is near the $15,600 level. The next major support is near the $15,550 level.
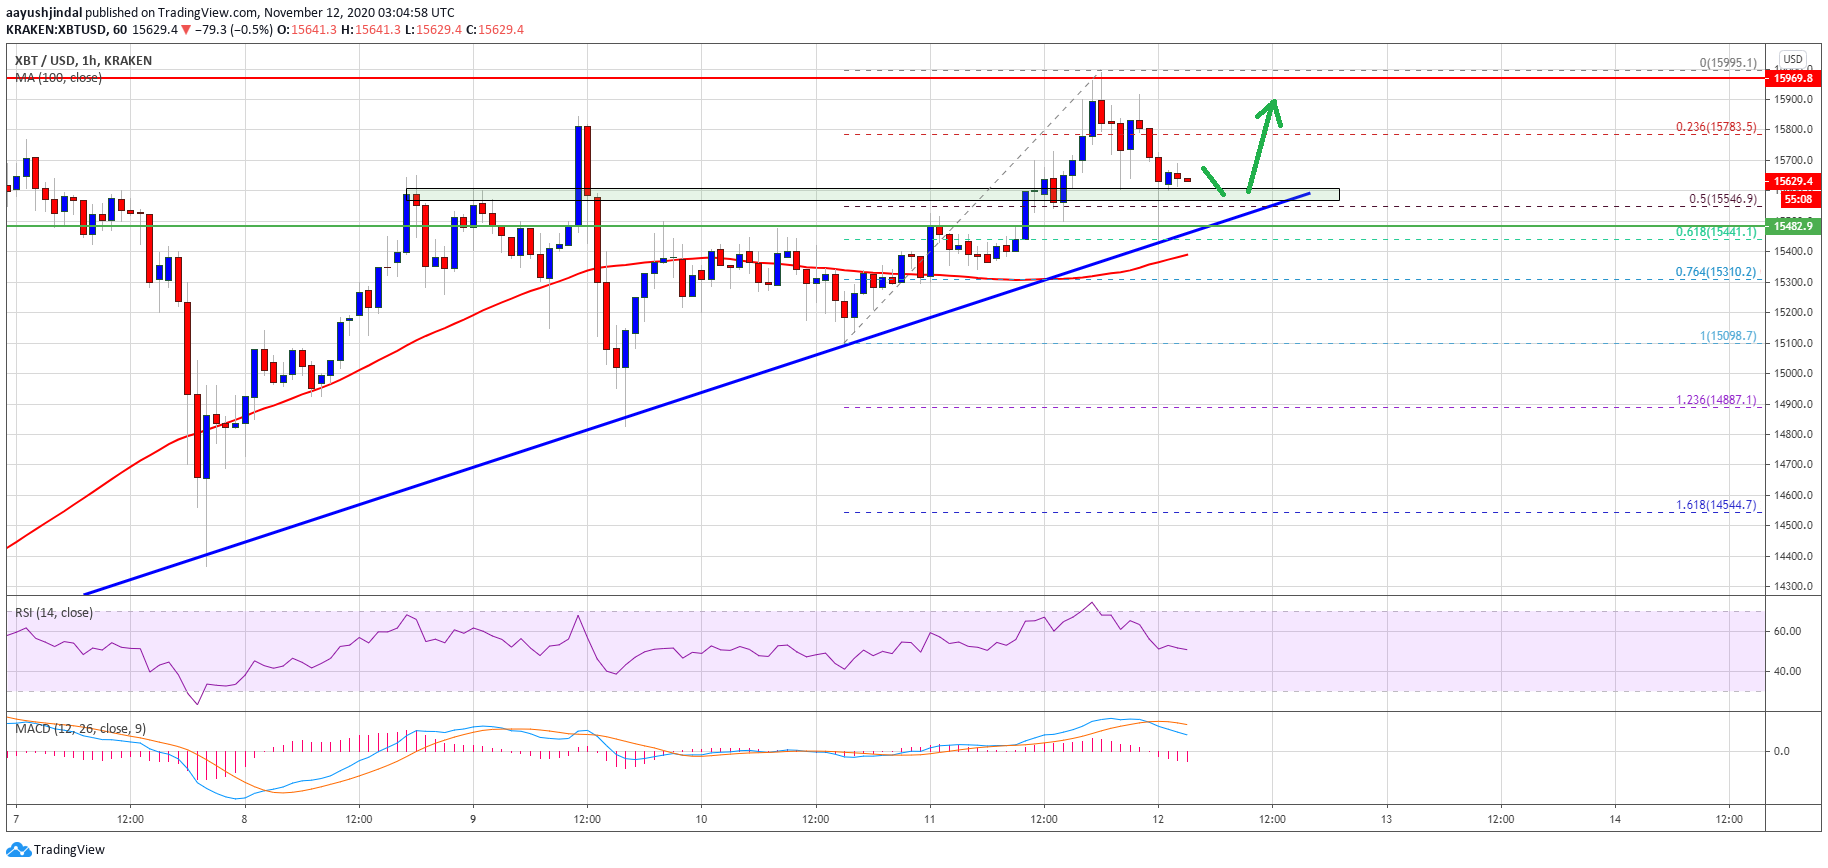
Source: BTCUSD on TradingView.com
There is also a crucial bullish trend line forming with support near $15,540 on the hourly chart of the BTC/USD pair. The trend line is close to the 50% Fib retracement level of the recent increase from the $15,098 swing low to $15,995 high.
On the upside, an immediate resistance is near $15,800, above which the price attempt a break above the $16,000 resistance. If there is a clear break above $16,000, the price could rally towards the $16,200 and $16,500 levels.
Repeat Role of 100 Hourly SMA for BTC?
If bitcoin fails to clear the $15,800 resistance, there could be a short-term downside correction. The first key support is near the trend line and $15,550.
The next major support is near the 100 hourly SMA at $15,400. If there is a clear break below the trend line support and the 100 hourly SMA, the price could start a fresh decline towards the $15,000 support.
Technical indicators:
Hourly MACD – The MACD is slowly moving in the bearish zone.
Hourly RSI (Relative Strength Index) – The RSI for BTC/USD is currently above the 50 level.
Major Support Levels – $15,600, followed by $15,550.
Major Resistance Levels – $15,800, $15,850 and $16,000.