
Reason to trust
How Our News is Made
Strict editorial policy that focuses on accuracy, relevance, and impartiality
Ad discliamer
Morbi pretium leo et nisl aliquam mollis. Quisque arcu lorem, ultricies quis pellentesque nec, ullamcorper eu odio.
Bitcoin price is currently correcting higher from the $10,550 support against the US Dollar. BTC is currently facing hurdles and it is likely to resume its decline below $10,550.
- Bitcoin is showing many bearish signs below the $10,800 resistance zone.
- The price is now trading below the $10,675 resistance and the 100 hourly simple moving average.
- There is a rising channel or a bearish flag pattern forming with support near $10,625 on the hourly chart of the BTC/USD pair (data feed from Kraken).
- The pair remains at a risk of a fresh decline unless it surges past $10,675 and $10,800.
Bitcoin Price is Facing Hurdles
Bitcoin price traded as low as $10,524 before starting an upside correction against the US Dollar. BTC corrected above the $10,550 and $10,600 levels, but it is still trading in a bearish zone.
There was a break above the 23.6% Fib retracement level of the downward move from the $10,801 swing high to $10,524 low. The price is currently facing a strong resistance near the $10,675 level and the 100 hourly simple moving average.
The 50% Fib retracement level of the downward move from the $10,801 swing high to $10,524 low is also near $10,665. It seems like there is a rising channel or a bearish flag pattern forming with support near $10,625 on the hourly chart of the BTC/USD pair.
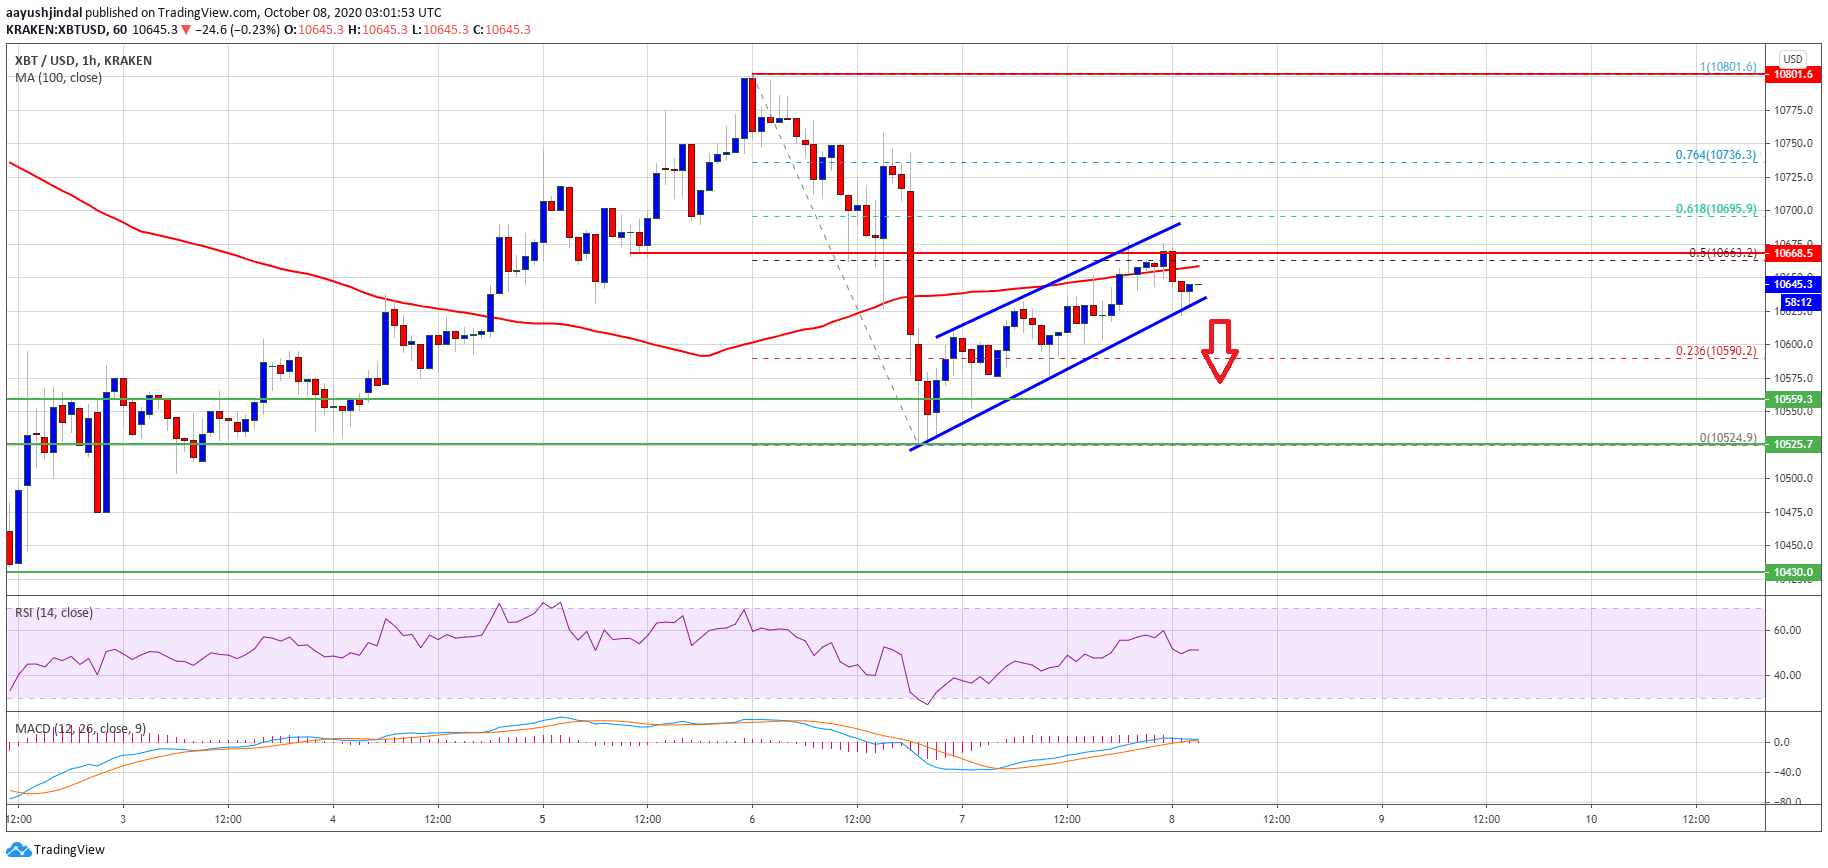
Bitcoin price trades above $10,550. Source: TradingView.com
If there is a downside break below the channel support and $10,600, there is a risk of more losses. The next key support is near the $10,550 level, below which the bears are likely to aim a test of the $10,200 support level in the coming sessions. An intermediate support could be near the $10,350 level.
Upside Break in BTC?
To avoid a downside break, bitcoin price must clear the $10,675 resistance and the 100 hourly simple moving average. The next immediate hurdle is near the $10,700 level, but the main hurdle is near $10,800.
A successful break above the $10,700 level and then a follow up move above the $10,800 level could set the pace for a possible break above the $11,000 resistance zone in the near term.
Technical indicators:
Hourly MACD – The MACD is slowly losing momentum in the bullish zone.
Hourly RSI (Relative Strength Index) – The RSI for BTC/USD is currently just above the 50 level.
Major Support Levels – $10,625, followed by $10,550.
Major Resistance Levels – $10,675, $10,800 and $10,950.


