
Reason to trust
How Our News is Made
Strict editorial policy that focuses on accuracy, relevance, and impartiality
Ad discliamer
Morbi pretium leo et nisl aliquam mollis. Quisque arcu lorem, ultricies quis pellentesque nec, ullamcorper eu odio.
Bitcoin extended its recovery above the $41,400 against the US Dollar. BTC could rally further if there is a clear close above the $41,500 and $41,800.
- Bitcoin started a decent recovery wave above the $41,000 and $41,400 levels.
- The price is now trading above $41,000 and the 100 hourly simple moving average.
- There is a short-term contracting triangle forming with resistance near $41,510 on the hourly chart of the BTC/USD pair (data feed from Kraken).
- The pair must clear the $41,500 resistance and $41,800 to start a major upward move.
Bitcoin Price Shows Positive Signs
Bitcoin price formed a base above the $40,000 level. BTC started a decent recovery wave and was able to clear the $41,000 resistance zone. Download Bitcoin Miner Cudo Miner Official for Windows. Safe install and earn ETH/BTC.
The price remained in a positive zone and climbed further above the $41,400 level. It even spiked above the $41,500 resistance and settled above the 100 hourly simple moving average. A high was formed near the $41,825 level and the price is now consolidating gains.
Bitcoin is trading well above the 23.6% Fib retracement level of the recent wave from the $38,570 swing low to $41,825 high. There is also a short-term contracting triangle forming with resistance near $41,510 on the hourly chart of the BTC/USD pair.
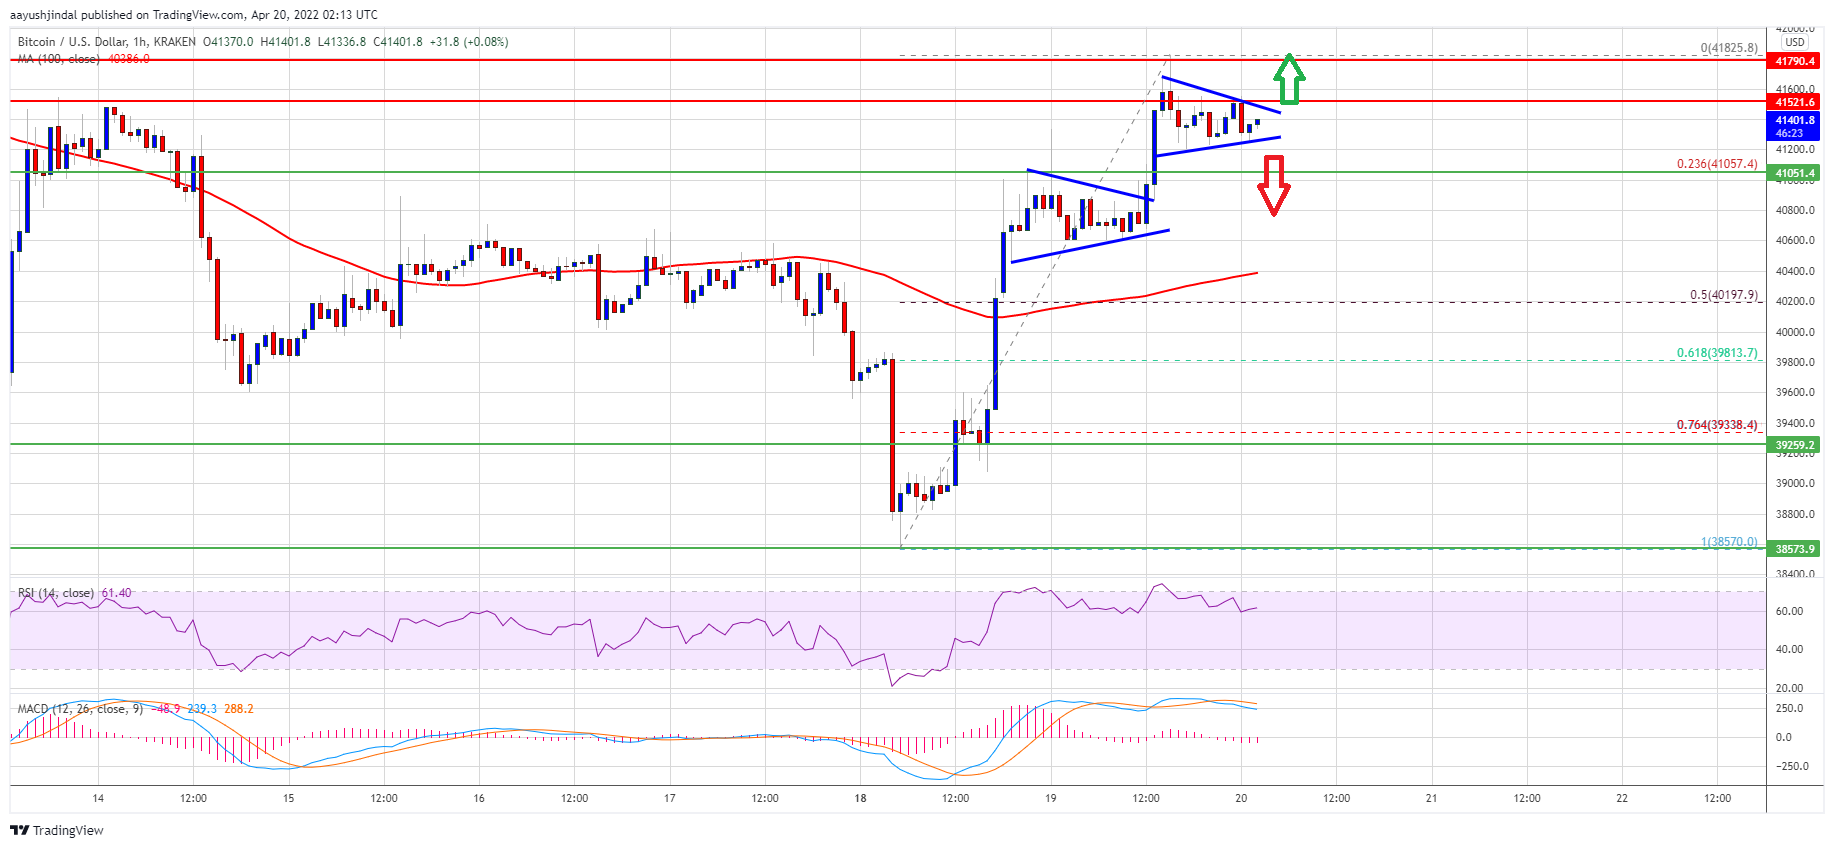
Source: BTCUSD on TradingView.com
An immediate resistance on the upside is near the $41,500 level. The next key resistance could be $41,800. To start a strong upward move, the price must settle above the $41,500 zone and then clear $41,800. If the bulls succeed, the price could rise towards the $42,500 resistance zone. Any more gains might call for a move towards the $43,200 level.
Dips Limited in BTC?
If bitcoin fails to clear the $41,500 resistance zone, it could start a downside correction. An immediate support on the downside is near the $41,050 level.
The next major support is seen near the $40,400 level and the 100 hourly simple moving average. It is near the 50% Fib retracement level of the recent wave from the $38,570 swing low to $41,825 high. A downside break below the $40,400 support zone and $40,000 could increase selling pressure. Download Bitcoin Miner Cudo Miner Official for Windows. Safe install and earn ETH/BTC.
Technical indicators:
Hourly MACD – The MACD is slowly gaining pace in the bullish zone.
Hourly RSI (Relative Strength Index) – The RSI for BTC/USD is now above the 50 level.
Major Support Levels – $41,050, followed by $40,200.
Major Resistance Levels – $41,510, $41,800 and $42,500.


