
Reason to trust
How Our News is Made
Strict editorial policy that focuses on accuracy, relevance, and impartiality
Ad discliamer
Morbi pretium leo et nisl aliquam mollis. Quisque arcu lorem, ultricies quis pellentesque nec, ullamcorper eu odio.
Bitcoin trimmed gains and declined below $21,000 against the US Dollar. BTC must stay above $20,500 to avoid a major decline in the near term.
- Bitcoin failed to stay above the $21,000 support and extended drop.
- The price is now trading below the $21,500 level and the 100 hourly simple moving average.
- There is a major bullish trend line forming with support near $20,520 on the hourly chart of the BTC/USD pair (data feed from Kraken).
- The pair could start another major decline if there is a clear move below $20,500.
Bitcoin Price Reaches Support
Bitcoin price attempted a close above the $22,000 level, but the bears remained active. As a result, there was a slow and steady decline below the $21,500 level.
The price declined below the 50% Fib retracement level of the upward move from the $19,300 swing low to $22,498 high. The price is now trading below the $21,500 level and the 100 hourly simple moving average.
It is testing the key $20,500 support zone. There is also a major bullish trend line forming with support near $20,520 on the hourly chart of the BTC/USD pair. The trend line is near the 61.8% Fib retracement level of the upward move from the $19,300 swing low to $22,498 high.
If bitcoin price stays above the trend line, it could correct above $20,800. On the upside, the price is facing resistance near the $20,800 and $20,850 levels.
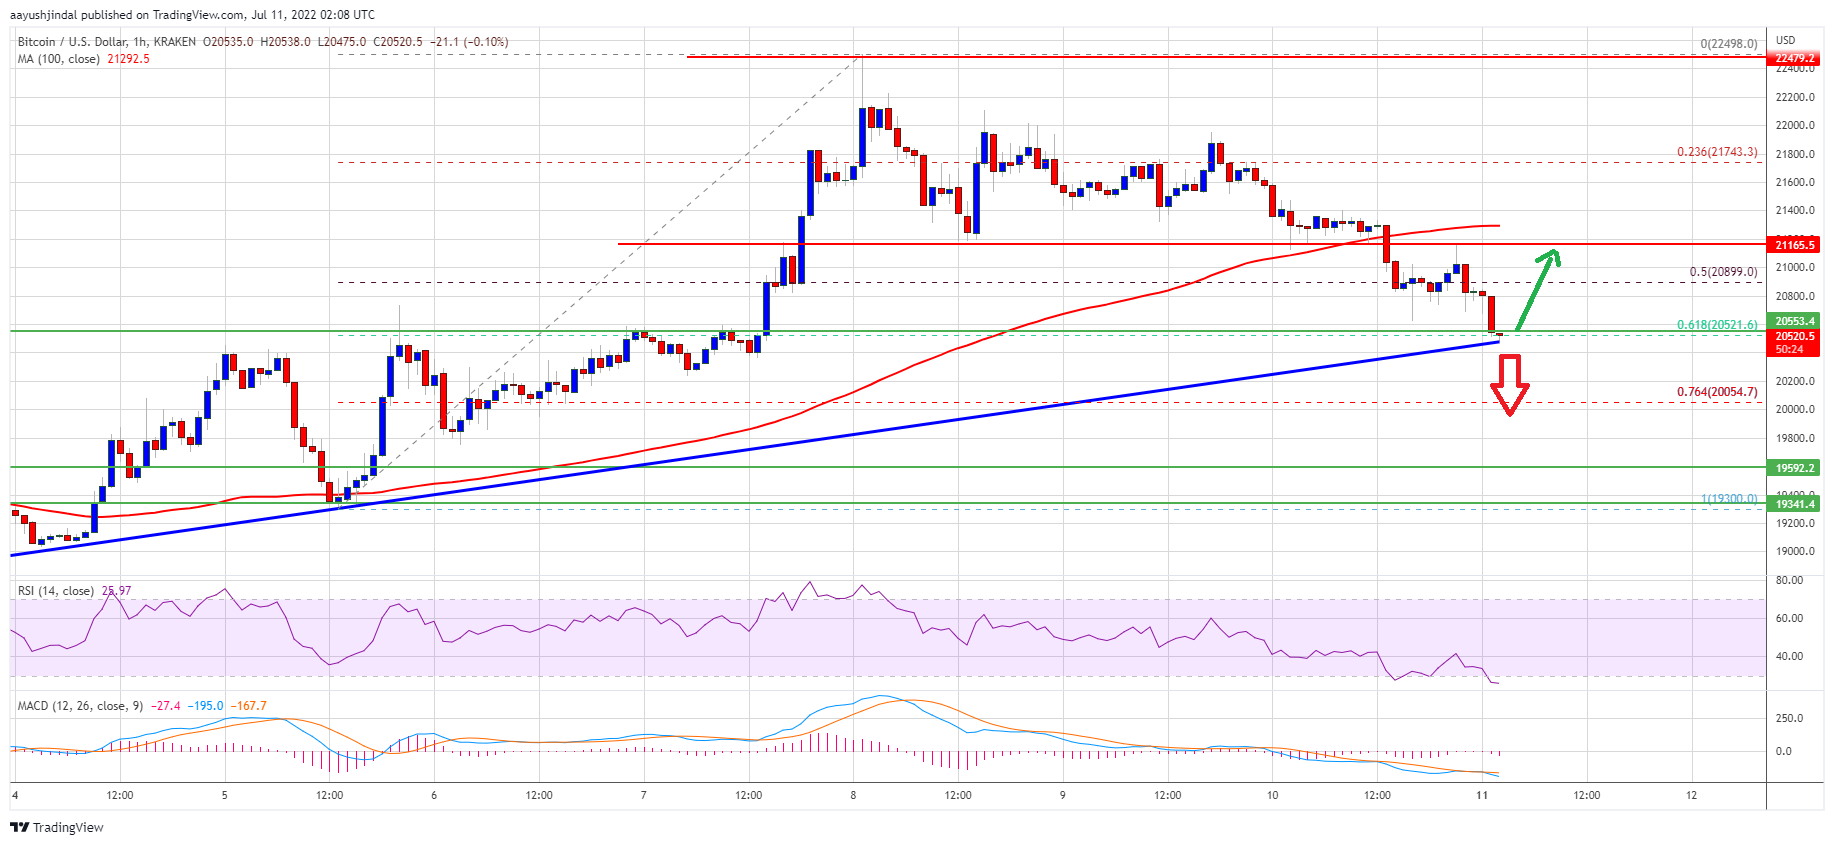
Source: BTCUSD on TradingView.com
The next key resistance is near the $21,250 zone and the 100 hourly simple moving average. A close above the $21,250 resistance zone could set the pace for a test of the $22,000 level. Any more gains might open the doors for an increase towards the $22,500 level. The next major resistance sits near the $23,200 level.
Downside Break in BTC?
If bitcoin fails to stay above the trend line support, it could continue to move down below $20,500. An immediate support on the downside is near the $20,050 level.
The next major support now sits near the $19,600 level or the last swing low. A close below the $19,600 support zone could push the price to $19,000. In the stated case, there is a risk of a move towards the $18,500 level.
Technical indicators:
Hourly MACD – The MACD is now gaining pace in the bearish zone.
Hourly RSI (Relative Strength Index) – The RSI for BTC/USD is now in the oversold zone.
Major Support Levels – $20,500, followed by $20,000.
Major Resistance Levels – $20,800, $21,250 and $22,000.