
Reason to trust
How Our News is Made
Strict editorial policy that focuses on accuracy, relevance, and impartiality
Ad discliamer
Morbi pretium leo et nisl aliquam mollis. Quisque arcu lorem, ultricies quis pellentesque nec, ullamcorper eu odio.
Bitcoin gained pace and even spiked above the $22,000 resistance against the US Dollar. BTC is correcting gains, but dips might be limited below $21,500.
- Bitcoin was able to clear the $21,200 and $21,500 resistance levels.
- The price is now trading above $21,500 and the 100 hourly simple moving average.
- There is a key bullish trend lien forming with support near $21,600 on the hourly chart of the BTC/USD pair (data feed from Kraken).
- The pair is correcting gains, but dips might be limited below the $21,500 level.
Bitcoin Price Starts Fresh Rally
Bitcoin price remained well bid above the $20,000 level and started a fresh increase. There was a clear move above the $21,000 and $21,200 resistance levels.
The price even surpassed the $21,500 resistance and spiked above the $22,000 resistance. A high was formed near $22,347 and the price recently started a downside correction. There was a move below the $22,000 and $21,850 levels.
Bitcoin price traded below the 23.6% Fib retracement level of the recent increase from the $21,180 swing low to $22,347 high. It is now trading above $21,500 and the 100 hourly simple moving average. Besides, there is a key bullish trend lien forming with support near $21,600 on the hourly chart of the BTC/USD pair.
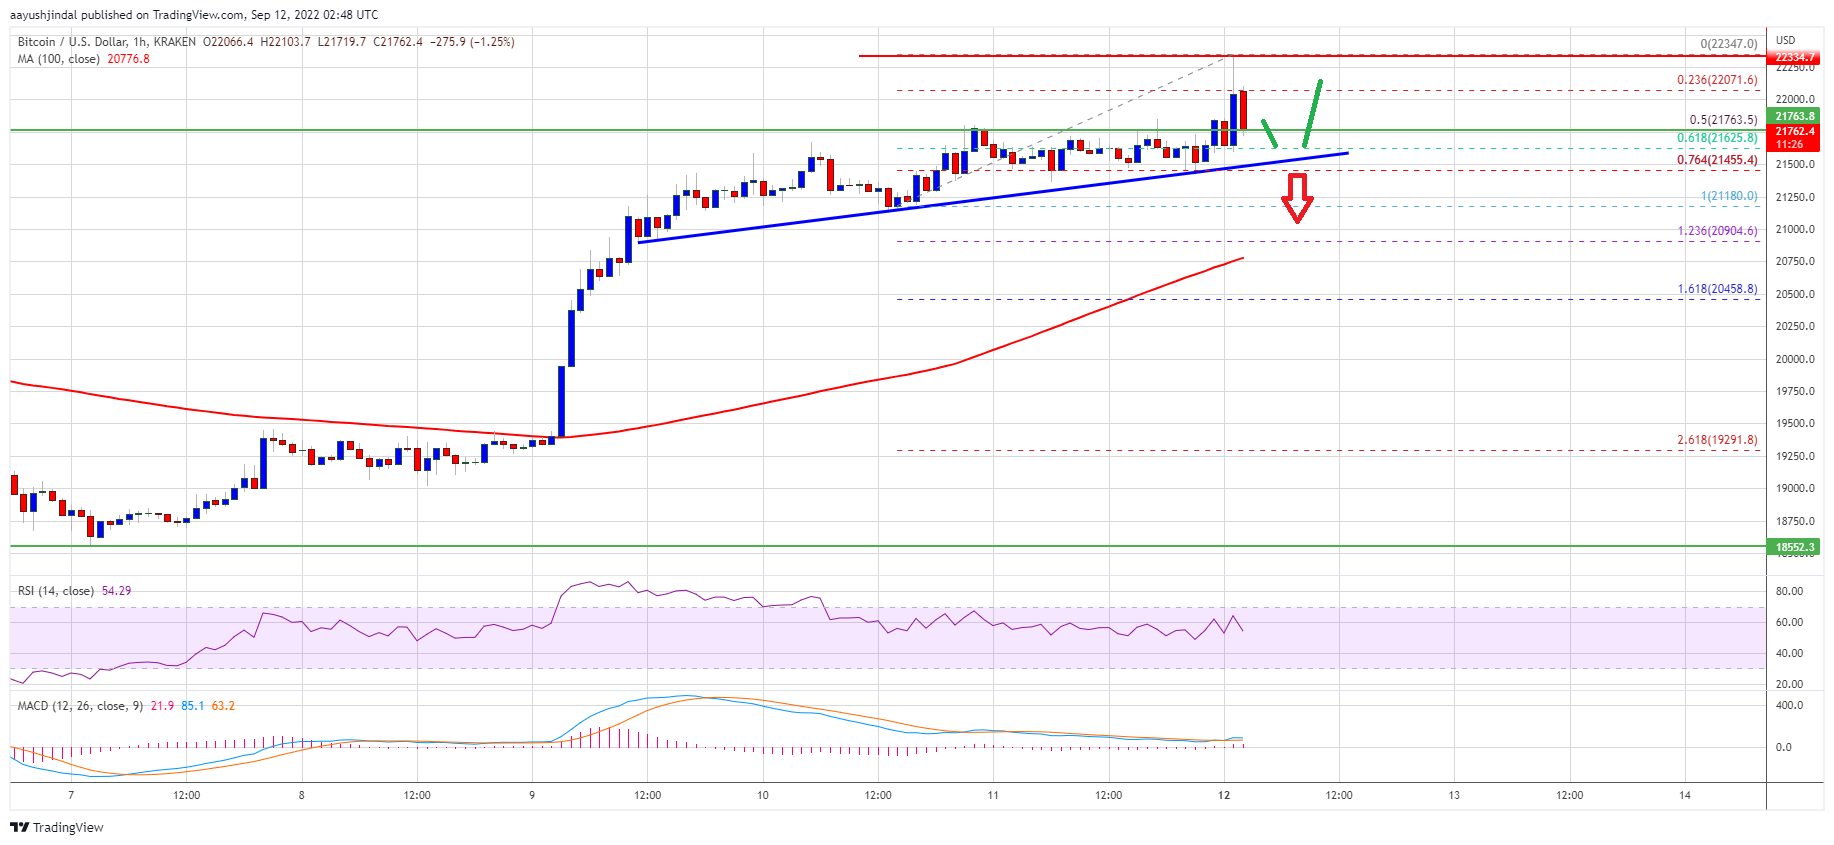
Source: BTCUSD on TradingView.com
On the upside, an immediate resistance is near the $22,000 level. The next major resistance sits near the $22,350 level. A clear move above the $22,350 resistance might start another steady increase. In the stated case, the price may perhaps rise towards $22,800. Any more gains might send the price towards the $23,200 resistance zone.
Dips Limited in BTC?
If bitcoin fails to gain pace above the $22,000 zone, it could start a downside correction. An immediate support on the downside is near the $21,700 zone.
The 50% Fib retracement level of the recent increase from the $21,180 swing low to $22,347 high is also near $21,700. The first major support is now forming near the $21,600 level. A downside break below the $21,600 level might send the price towards the $21,200 support.
Technical indicators:
Hourly MACD – The MACD is now gaining pace in the bearish zone.
Hourly RSI (Relative Strength Index) – The RSI for BTC/USD is now above the 50 level.
Major Support Levels – $21,700, followed by $21,600.
Major Resistance Levels – $22,000, $22,350 and $23,200.


