
Reason to trust
How Our News is Made
Strict editorial policy that focuses on accuracy, relevance, and impartiality
Ad discliamer
Morbi pretium leo et nisl aliquam mollis. Quisque arcu lorem, ultricies quis pellentesque nec, ullamcorper eu odio.
Bitcoin price failed to correct above the $55,750 zone against the US Dollar. BTC is showing bearish signs and it remains at a risk of more losses below $54,000.
- Bitcoin failed to correct higher and it struggled to settle above $55,500.
- The price is now trading well below $55,500 and the 100 hourly simple moving average.
- There is a key bearish trend line forming with resistance near $56,000 on the hourly chart of the BTC/USD pair (data feed from Kraken).
- The pair is likely to decline heavily if it fails to stay above $54,000 and $53,750.
Bitcoin Price Signaling Bearish Signs
Yesterday, we saw a crucial decline in bitcoin below the $55,500 support zone. BTC even broke the $54,000 level before starting an upside correction.
There was a recovery above the $55,000 resistance. The price even climbed above $55,500, but there was no follow up move. A high was formed near $55,757 before the price declined again. It broke the $55,000 support zone.
It is now trading well below $55,500 and the 100 hourly simple moving average. There is also a key bearish trend line forming with resistance near $56,000 on the hourly chart of the BTC/USD pair.
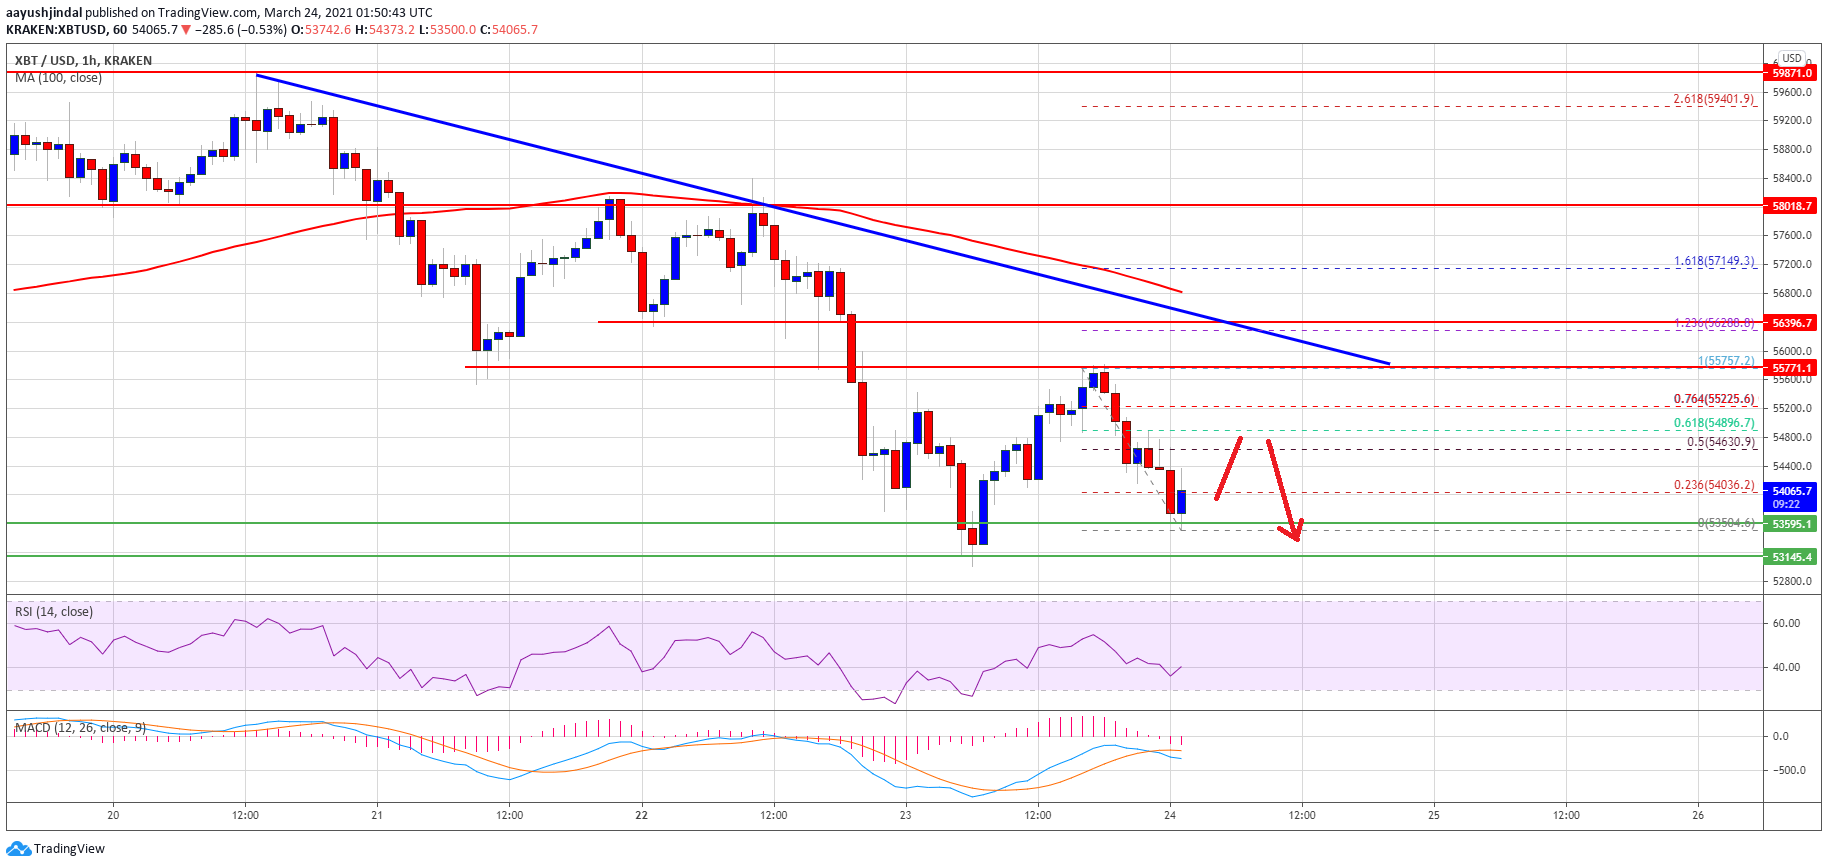
Source: BTCUSD on TradingView.com
An initial resistance on the upside is near the $54,650 level. It is near the 50% Fib retracement level of the recent drop from the $55,757 high to $53,504 low. The first major resistance is near the $54,850 and $55,000 levels.
The 61.8% Fib retracement level of the recent drop from the $55,757 high to $53,504 low is also near $54,850. To start a steady recovery, the price must settle above $55,000 and $55,500. The next major resistance for the bulls could be near the $57,000 region.
More Losses in BTC?
If bitcoin fails to correct higher above $55,000 and $55,500, there are chances of more downsides in the near term. An initial support is near the $54,000 level.
The key support is now near the $53,150 level, below which the bears might aim a test of the $50,000 support zone in the near term.
Technical indicators:
Hourly MACD – The MACD is now gaining momentum in the bearish zone.
Hourly RSI (Relative Strength Index) – The RSI for BTC/USD is now well below the 50 level.
Major Support Levels – $53,000, followed by $51,750.
Major Resistance Levels – $54,850, $55,000 and $55,500.


