
Reason to trust
How Our News is Made
Strict editorial policy that focuses on accuracy, relevance, and impartiality
Ad discliamer
Morbi pretium leo et nisl aliquam mollis. Quisque arcu lorem, ultricies quis pellentesque nec, ullamcorper eu odio.
Bitcoin price surged above the $0,000 level before started a downside correction against the US Dollar. BTC is now testing a major support at $38,600, below which it could decline to $36,000.
- Bitcoin climbed above the $38,000 resistance, but it struggled to stay above $40,000.
- The price is trading near the $38,600 support, but it is well above the 100 simple moving average (4-hours).
- There is a key bullish trend line forming with support near $38,650 on the 4-hours chart of the BTC/USD pair (data feed from Kraken).
- The pair could either decline heavily towards $36,000 or it might climb back above $40,000.
Bitcoin Price Remains At Risk
This past week, bitcoin price saw a decent upward move above the $36,000 resistance against the US Dollar. The BTC/USD pair even climbed above the $38,000 resistance to move further into a positive zone.
The price broke the $40,000 resistance and it settled above the 100 simple moving average (4-hours). A high was formed near $41,050 before the price started a downside correction. There was a break below the $39,500 and $39,000 levels.
The price even traded below the 23.6% Fib retracement level of the upward move from the $36,217 swing low to $41,050 high. Bitcoin is now trading near the $38,600 support level.
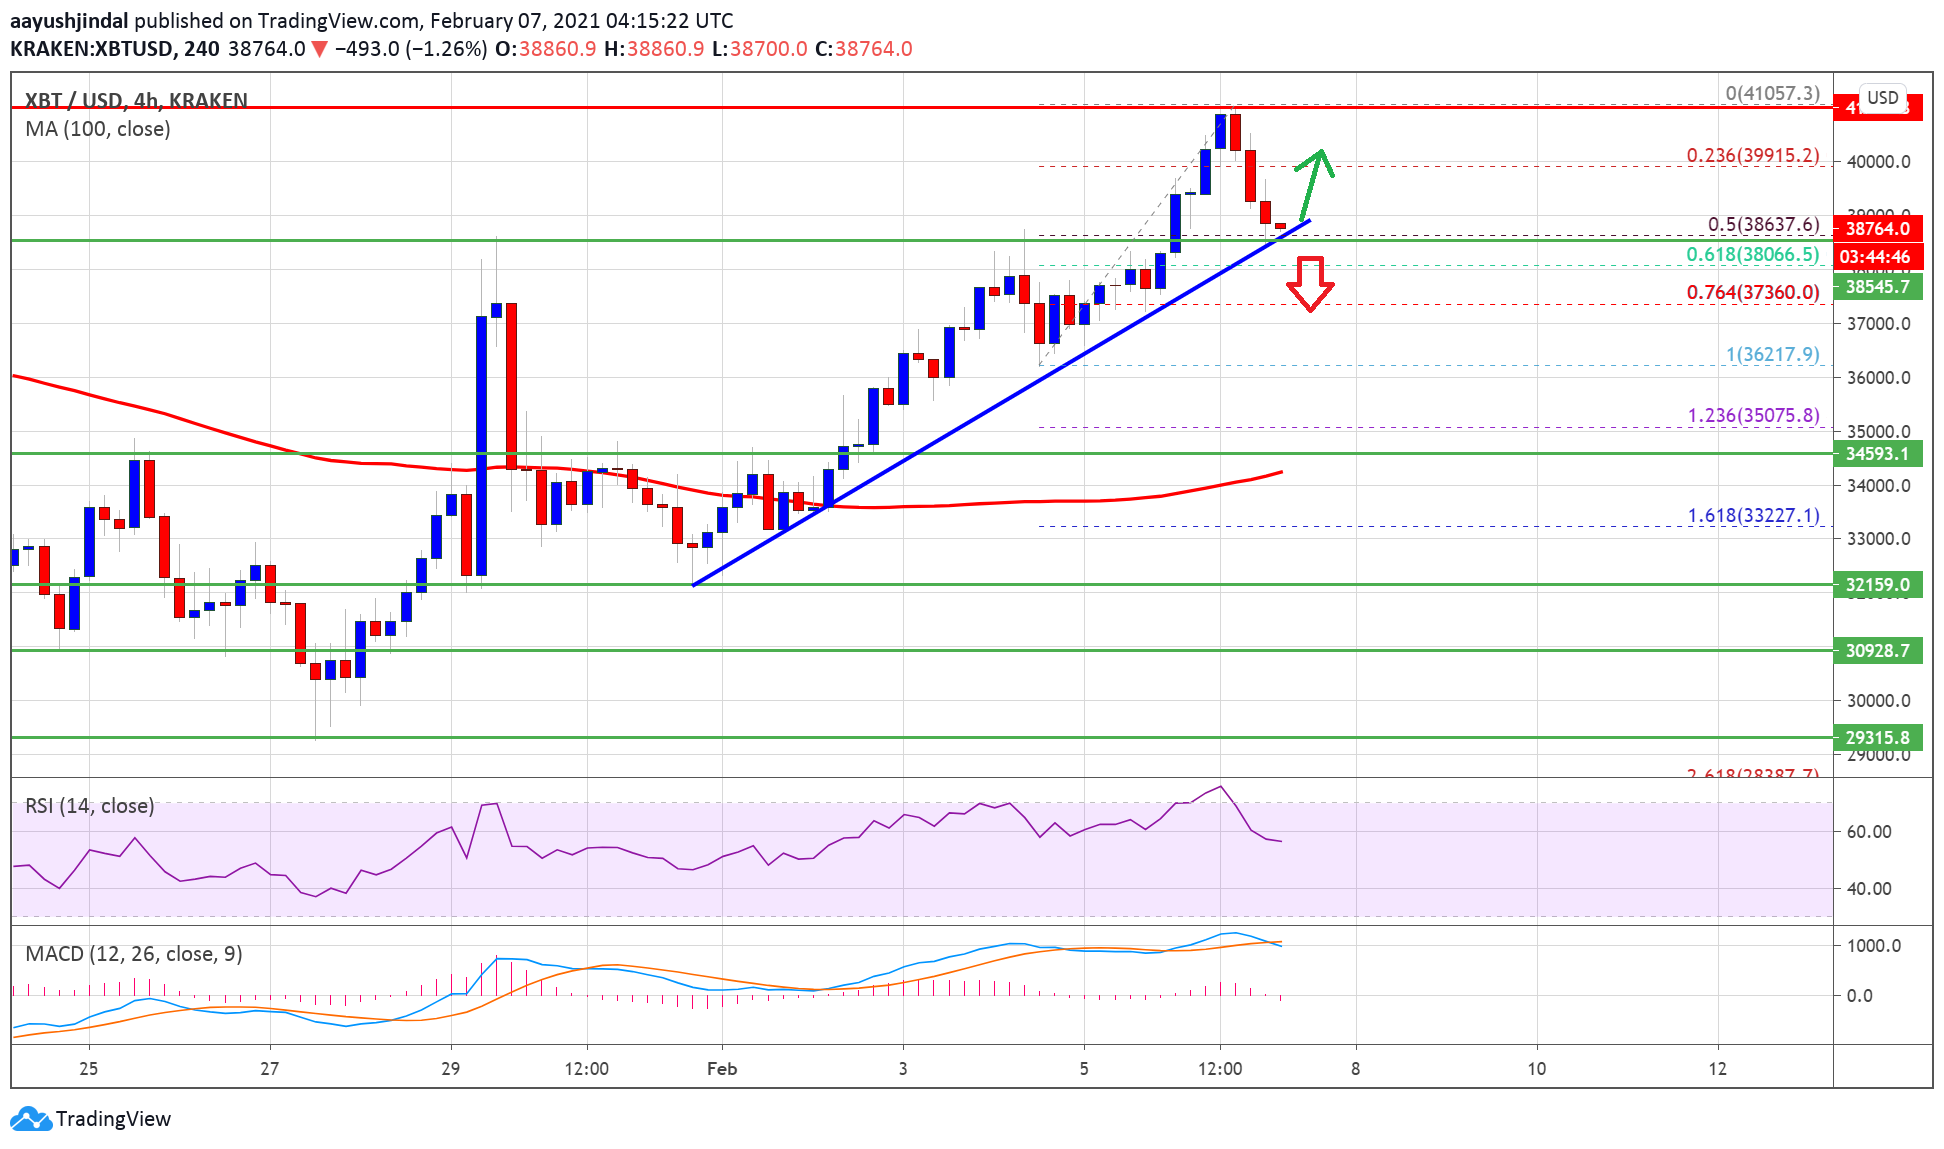
Source: BTCUSD on TradingView.com
There is also a key bullish trend line forming with support near $38,650 on the 4-hours chart of the BTC/USD pair. The 50% Fib retracement level of the upward move from the $36,217 swing low to $41,050 high is also near the trend line to provide support.
A downside break below the trend line support could open the doors for a larger decline below $37,000. The next major support is near the $36,000 level.
Fresh Increase in BTC?
If bitcoin stays above the trend line support, there are chances of a fresh increase above $39,500. An initial resistance on the upside is near the $40,000 level.
A proper break and close above the $40,000 resistance will most likely set the pace for a sustained upward move in the coming sessions. The next major resistance on the upside is near the $41,500 level.
Technical indicators
4 hours MACD – The MACD for BTC/USD is slowly gaining momentum in the bearish zone.
4 hours RSI (Relative Strength Index) – The RSI for BTC/USD is still above the 50 level.
Major Support Level – $38,600
Major Resistance Level – $40,000