
Reason to trust
How Our News is Made
Strict editorial policy that focuses on accuracy, relevance, and impartiality
Ad discliamer
Morbi pretium leo et nisl aliquam mollis. Quisque arcu lorem, ultricies quis pellentesque nec, ullamcorper eu odio.
Bitcoin price traded to a new swing low at $43,000 before correcting higher against the US Dollar. BTC is now facing a strong resistance near $47,000 and the 100 hourly SMA.
- Bitcoin extended its decline below the $45,000 support and tested the $43,000 zone.
- The price is now recovering higher towards the $47,000 resistance and the 100 hourly simple moving average.
- There is a key bearish trend line forming with resistance near $48,000 on the hourly chart of the BTC/USD pair (data feed from Kraken).
- The pair must break $47,000 and $48,000 to move into a positive zone in the near term.
Bitcoin Price is Facing Hurdles
After a downside break below $48,000, bitcoin even extended its decline below the $45,000 support level. BTC tested the $43,000 zone and it settled below the 100 hourly simple moving average.
It is currently correcting higher and trading above the $45,000 level. There was a break above the 50% Fib retracement level of the recent decline from the $48,307 high to $43,004 low.
Bitcoin is now approaching a couple of important hurdles, starting with $47,000. The 100 hourly simple moving average is near the $47,000 level to act as a resistance. The 76.4% Fib retracement level of the recent decline from the $48,307 high to $43,004 low is also at $47,050.
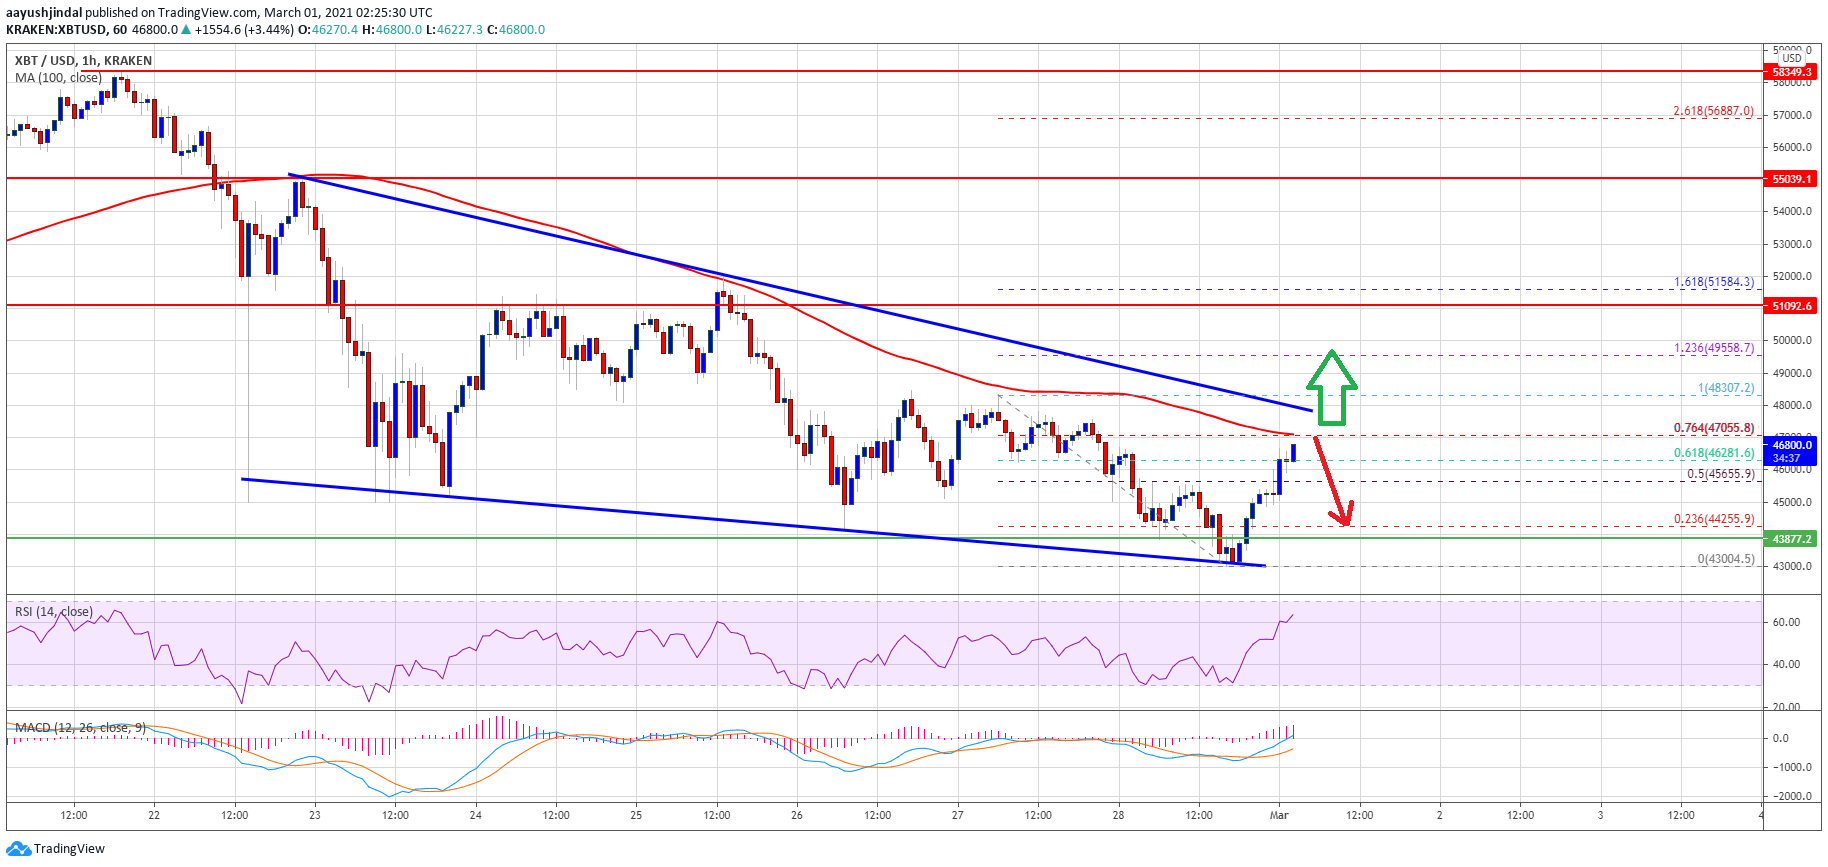
Source: BTCUSD on TradingView.com
The next major resistance is near the $48,000 level. There is also a key bearish trend line forming with resistance near $48,000 on the hourly chart of the BTC/USD pair.
To start a strong increase, the bulls need to clear the 100 hourly SMA and then $48,000. The next major resistance could be $50,000, above which the bulls are likely to gain strength.
More Losses in BTC?
If bitcoin fails to continue higher above the $47,000 and $48,000 resistance levels, there could be more losses. An initial support on the downside is near the $45,000 level.
The first major support is now near the $43,800 zone. If there is a clear break below the $43,800 support, the price could test the $42,000 support zone.
Technical indicators:
Hourly MACD – The MACD is slowly gaining momentum in the bullish zone.
Hourly RSI (Relative Strength Index) – The RSI for BTC/USD is now back above the 50 level.
Major Support Levels – $45,000, followed by $43,800.
Major Resistance Levels – $47,000, $48,000 and $50,000.