
Reason to trust
How Our News is Made
Strict editorial policy that focuses on accuracy, relevance, and impartiality
Ad discliamer
Morbi pretium leo et nisl aliquam mollis. Quisque arcu lorem, ultricies quis pellentesque nec, ullamcorper eu odio.
Bitcoin price is up over 15% and trading near the $35,000 resistance. BTC could correct in the short term before it starts another increase.
- Bitcoin started a strong increase after there was speculation of spot ETF being listed DTCC.
- The price is trading above $34,000 and the 100 hourly Simple moving average.
- There is a connecting bullish trend line forming with support near $32,500 on the hourly chart of the BTC/USD pair (data feed from Kraken).
- The pair could correct in the short term before it resumes its increase.
Bitcoin Price Jumps Over 15%
Bitcoin price started a strong increase after there was speculation of spot ETF being listed DTCC. BTC gained bullish momentum after it broke the $32,000 resistance zone.
There was a decent increase toward the $35,000 resistance zone. A new multi-week high is formed near $35,225 and the price is now consolidating gains. It is trading well above the 23.6% Fib retracement level of the upward move from the $30,400 swing low to the $35,225 high.
Bitcoin is now trading above $34,000 and the 100 hourly Simple moving average. There is also a connecting bullish trend line forming with support near $32,500 on the hourly chart of the BTC/USD pair. The trend line is near the 61.8% Fib retracement level of the upward move from the $30,400 swing low to the $35,225 high.
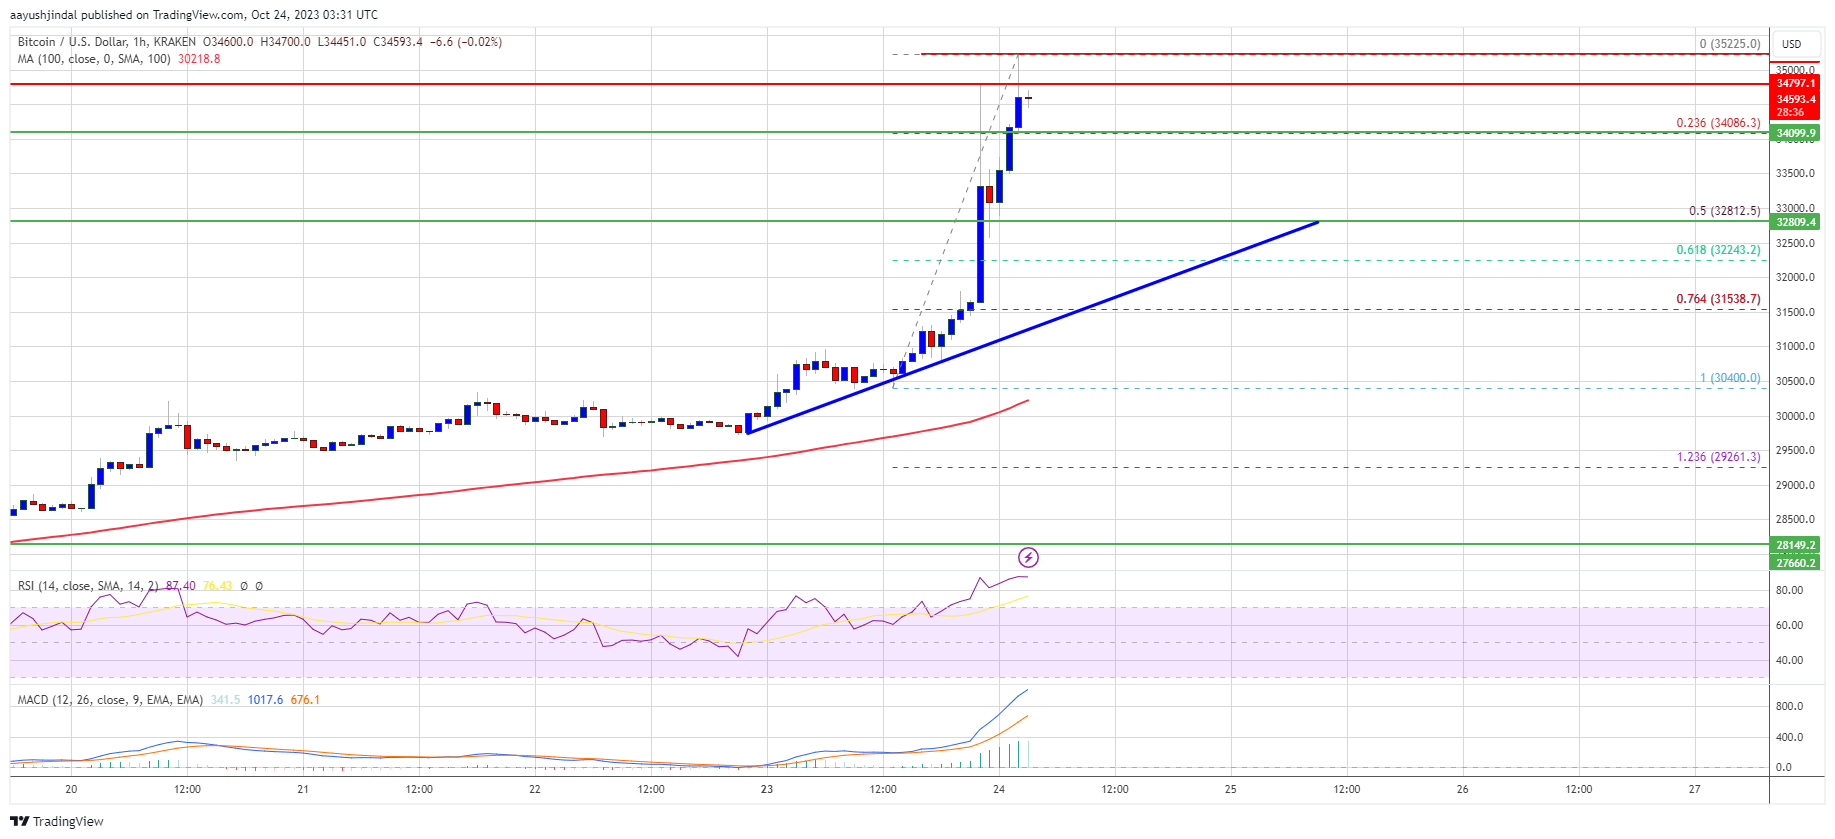
Source: BTCUSD on TradingView.com
On the upside, immediate resistance is near the $34,800 level. The next key resistance could be near $35,250. A clear move above the recent high might send the price toward the $36,200 resistance. The next key resistance could be $37,000. Any more gains might send BTC toward the $38,000 level in the coming days.
Downsides Supported In BTC?
If Bitcoin fails to rise above the $34,800 resistance zone, it could start a downside correction. Immediate support on the downside is near the $34,120 level.
The next major support is near the $32,800 level and the trend line. If there is a move below the trend line support, the price may perhaps decline toward the $31,500 level in the coming sessions.
Technical indicators:
Hourly MACD – The MACD is now gaining pace in the bullish zone.
Hourly RSI (Relative Strength Index) – The RSI for BTC/USD is now above the 50 level.
Major Support Levels – $34,120, followed by $32,800.
Major Resistance Levels – $34,800, $35,000, and $35,250.