
Reason to trust
How Our News is Made
Strict editorial policy that focuses on accuracy, relevance, and impartiality
Ad discliamer
Morbi pretium leo et nisl aliquam mollis. Quisque arcu lorem, ultricies quis pellentesque nec, ullamcorper eu odio.
Bitcoin price is still struggling to clear the $31,000 resistance. BTC is showing strength and might soon rally toward the $32,000 resistance.
- Bitcoin is trading in a range below the $31,000 resistance zone.
- The price is trading above $30,400 and the 100 hourly Simple moving average.
- There was a break above a key declining channel with resistance near $30,210 on the hourly chart of the BTC/USD pair (data feed from Kraken).
- The pair could gain bullish momentum if it clears the $30,750 resistance zone.
Bitcoin Price Aims Higher
Bitcoin price corrected lower below the $30,500 support zone. BTC even spiked below the $30,000 level but downsides were limited. A low is formed near $29,834 and the price is again rising.
There was a move above the $30,000 and $30,200 resistance levels. The price climbed above the 50% Fib retracement level of the downward move from the $31,008 swing high to the $29,834 low. Besides, there was a break above a key declining channel with resistance near $30,210 on the hourly chart of the BTC/USD pair.
Bitcoin price is now trading above $30,400 and the 100 hourly Simple moving average. It is also trading above the $30,550 pivot level. Immediate resistance is near the $30,750 level. It is close to the 76.4% Fib retracement level of the downward move from the $31,008 swing high to the $29,834 low.
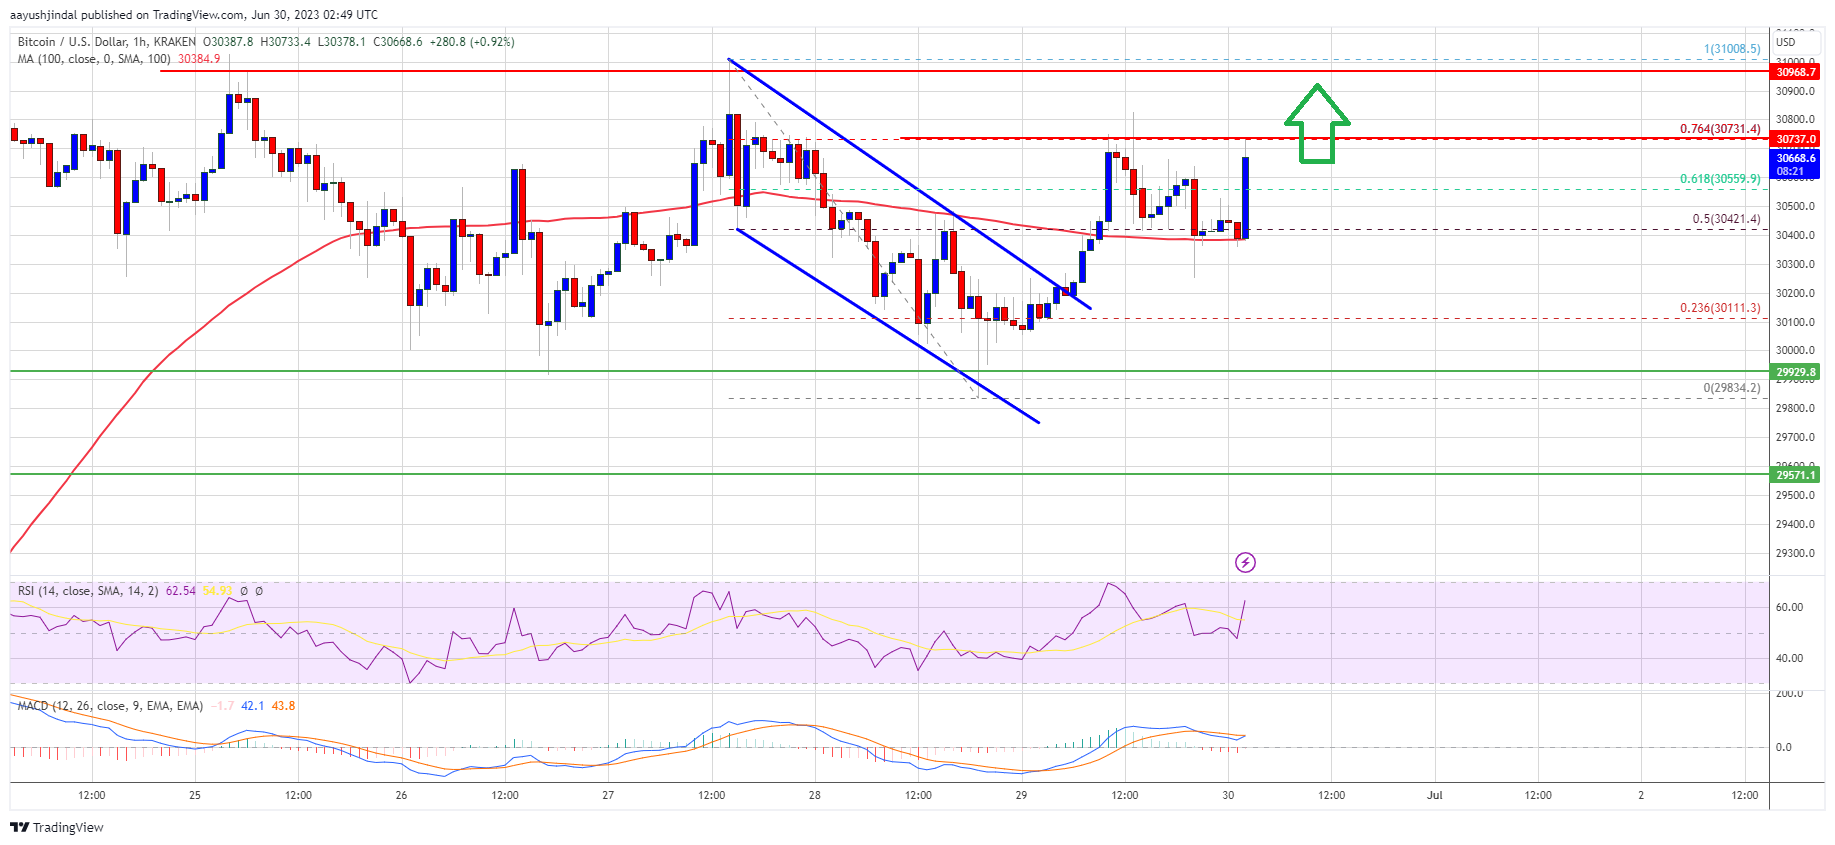
Source: BTCUSD on TradingView.com
The first major resistance is near the $31,000 level, above which the price gain bullish momentum. The next major resistance is near the $31,450 level. An upside break above the $31,450 resistance might send BTC toward $32,000. Any more gains could open the doors for a move toward the $32,500 resistance zone.
Another Dip in BTC?
If Bitcoin’s price fails to clear the $30,750 resistance, it could start another decline. Immediate support on the downside is near the $30,420 level and the 100 hourly Simple moving average.
The next major support is near the $30,000 level, below which there could be a drop toward the $29,550 support. Any more losses might send the price toward the $29,000 zone in the near term.
Technical indicators:
Hourly MACD – The MACD is now gaining pace in the bullish zone.
Hourly RSI (Relative Strength Index) – The RSI for BTC/USD is above the 50 level.
Major Support Levels – $30,420, followed by $30,000.
Major Resistance Levels – $30,750, $31,000, and $31,450.


