
Reason to trust
How Our News is Made
Strict editorial policy that focuses on accuracy, relevance, and impartiality
Ad discliamer
Morbi pretium leo et nisl aliquam mollis. Quisque arcu lorem, ultricies quis pellentesque nec, ullamcorper eu odio.
Bitcoin price started a sharp decline after it broke the $60,000 support zone against the US Dollar. BTC is correcting gains, but it is likely to face sellers below $58,000.
- Bitcoin declined heavily below the $60,000 and $58,000 support levels.
- The price is now trading well below $58,000 and the 100 simple moving average (4-hours).
- There was a break below a key bullish trend line with support near $62,000 on the 4-hours chart of the BTC/USD pair (data feed from Kraken).
- The pair is correcting losses, but it might face resistance near $58,000 and $60,000.
Bitcoin Price is Down 12%
This past week, bitcoin price saw a decent increase above the $62,000 resistance against the US Dollar. The BTC/USD pair traded to a new all-time above $64,000 and it settled above the 100 simple moving average (4-hours).
However, there was a substantial downside correction from well above $62,000 in the past few sessions. The price declined heavily below the $60,000 and $58,000 support levels.
The bears were able to push the price below the $55,000 support zone and the 100 simple moving average (4-hours). A low is formed near $51,132 and the price is now correcting higher. It broke the $52,000 and $53,200 resistance levels.
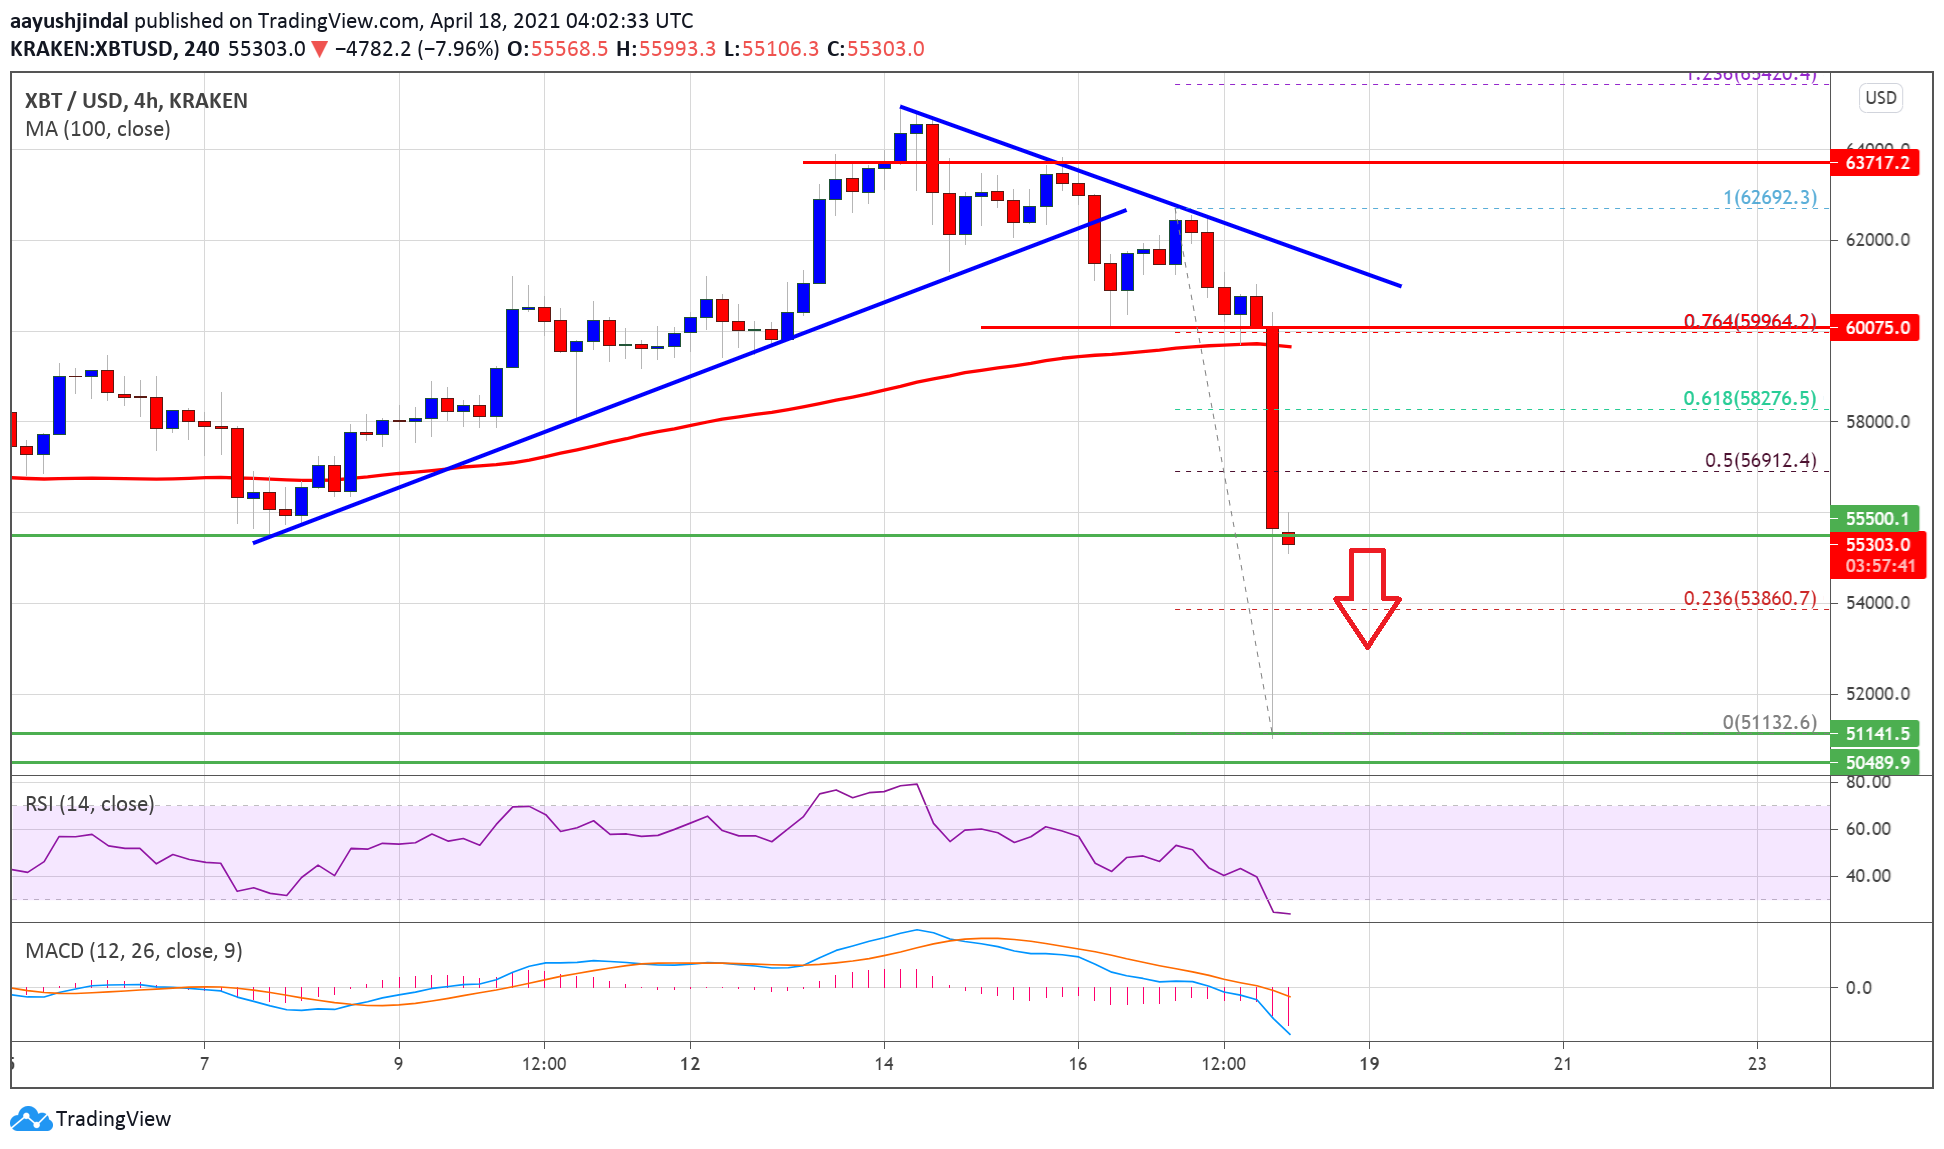
Source: BTCUSD on TradingView.com
Bitcoin cleared the 23.6% Fib retracement level of the recent decline from the $62,692 high to $51,132 low. The price is now facing resistance near the $55,500 and $56,000 levels.
The first major resistance is near the $57,000 level. It is near the 50% Fib retracement level of the recent decline from the $62,692 high to $51,132 low. The main resistance is now forming near the $58,500 level, above which the price might start a fresh increase.
More Losses in BTC?
If bitcoin fails above the $56,000 level, there is a risk of more losses. The first major support is near the $55,000 and $54,800 levels.
The next major support is near the $53,800 level. Any more losses might call for a fresh drop towards the $52,000 support levels. In the stated case, there are even chances of a drop towards the main $50,000 support zone in the near term.
Technical indicators
4 hours MACD – The MACD for BTC/USD is gaining momentum in the bearish zone.
4 hours RSI (Relative Strength Index) – The RSI for BTC/USD is now well below the 40 level.
Major Support Level – $53,800
Major Resistance Level – $57,000