
Reason to trust
How Our News is Made
Strict editorial policy that focuses on accuracy, relevance, and impartiality
Ad discliamer
Morbi pretium leo et nisl aliquam mollis. Quisque arcu lorem, ultricies quis pellentesque nec, ullamcorper eu odio.
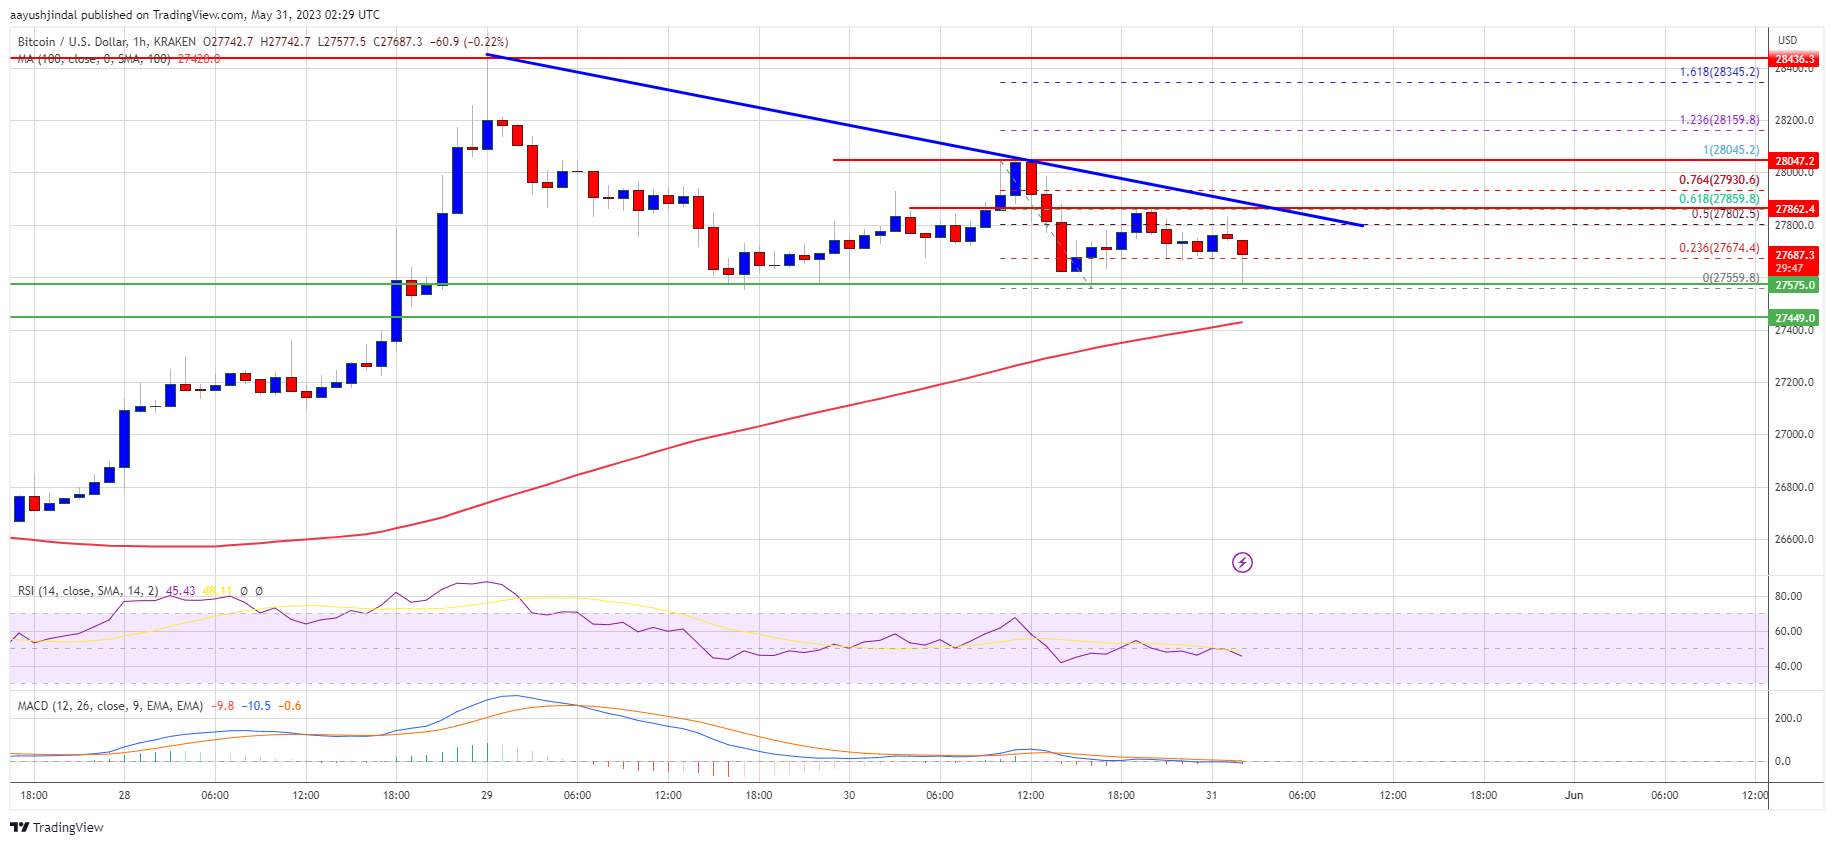
Bitcoin price is consolidating above the $27,500 support. BTC could start a fresh increase unless there is a clear move and close below $27,500.
- Bitcoin is still holding the key $27,500 support zone.
- The price is trading above $27,550 and the 100 hourly Simple moving average.
- There is a key bearish trend line forming with resistance near $27,850 on the hourly chart of the BTC/USD pair (data feed from Kraken).
- The pair could start a fresh increase if there is a break above the $28,000 resistance zone.
Bitcoin Price Holds Support
Bitcoin price started a downside correction after it failed to clear the $28,500 resistance zone. BTC moved below the $28,200 and $28,000 levels.
There was also a drop below the $27,800 level but the bulls were active near the $27,500 support. A low is formed near $27,559 and the price is now consolidating. There was already a test of the 50% Fib retracement level of the recent decline from the $28,045 swing high to the $27,559 low.
Bitcoin price is now trading above $27,550 and the 100 hourly Simple moving average. There is also a key bearish trend line forming with resistance near $27,850 on the hourly chart of the BTC/USD pair.
Immediate resistance on the upside is near the $27,850 level and the trend line. The next major resistance is near the $28,000 level or the 76.4% Fib retracement level of the recent decline from the $28,045 swing high to the $27,559 low.
Source: BTCUSD on TradingView.com
An upside break and close above $28,000 could start a steady increase toward $28,500. If the bulls manage to clear the $28,500 resistance zone might send the price toward the $29,200 resistance zone. The next key resistance is near $29,500, above which the price might rise toward the $30,000 resistance.
Downside Break in BTC?
If Bitcoin’s price fails to clear the $28,000 resistance, it could continue to move down. Immediate support on the downside is near the $27,550 level.
The next major support is near the $27,500 zone and the 100 hourly SMA, below which the price might start a steady decline. In the stated case, the price could drop toward the $27,000 support.
Technical indicators:
Hourly MACD – The MACD is now gaining pace in the bearish zone.
Hourly RSI (Relative Strength Index) – The RSI for BTC/USD is below the 50 level.
Major Support Levels – $27,550, followed by $27,500.
Major Resistance Levels – $28,000, $28,400, and $28,500.